Chapter 3 · Trading · Lesson 4 · 4 min
Chart
Price candles for one outcome, with your orders, position and fills on top. Trade and set alerts on it.
The Chart shows an outcome's price as candles, with your orders, position and fills drawn on top, and you can trade and set alerts right on it. It follows its colour group's market and outcome.
What you see
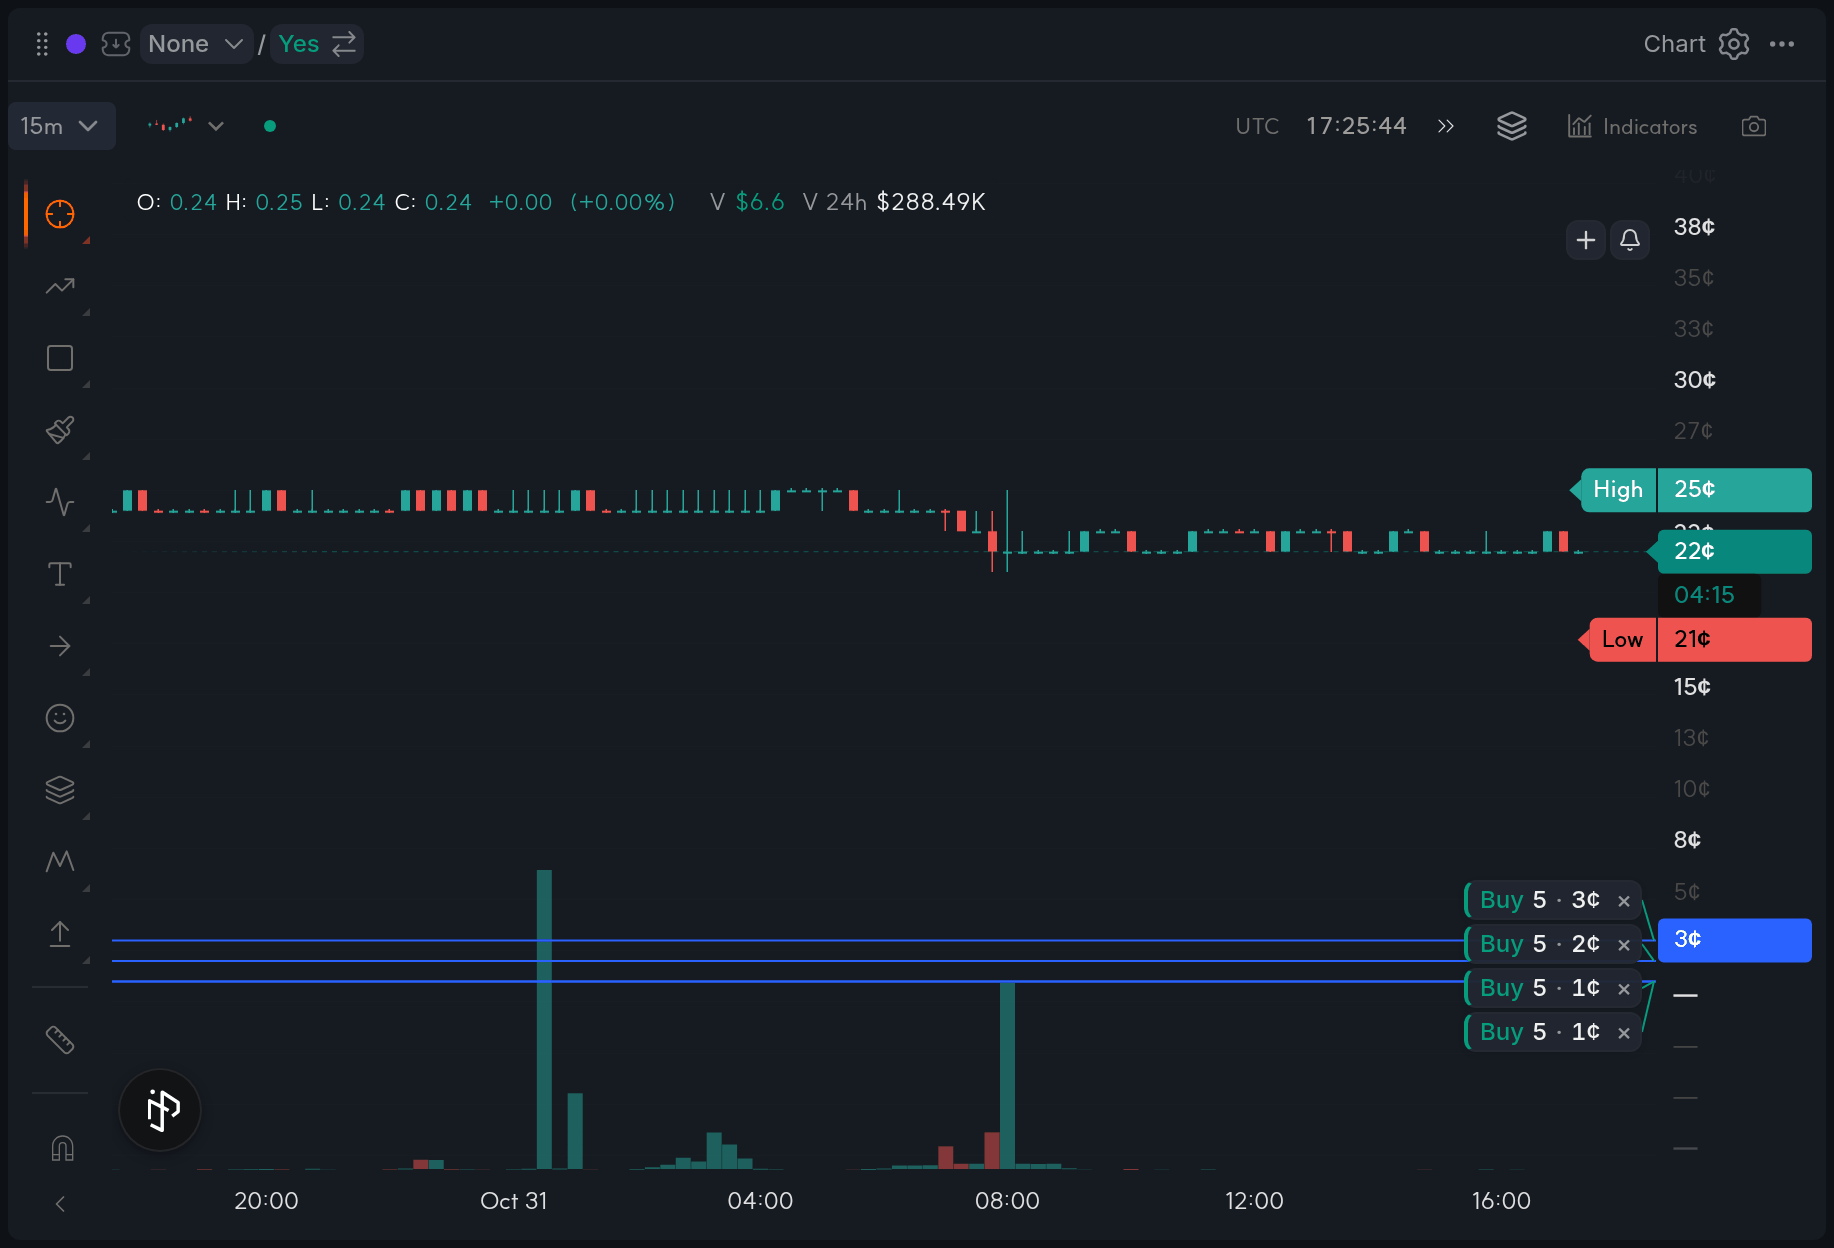
- 1Candle chip
- 2Legend: bar, 24h volume
- 3Live dot
- 4Your Buy order pill
- 5+ and bell at cursor price
Candles are in cents, built from every trade; No is the mirror of Yes (100¢ minus the price). The legend shows the bar under your cursor plus 24h change and volume, and a small dot tells you live trades are streaming in.
The candle chip sets how long one bar is, from 1m to 1W (15m by default), not how much history you see: zoom and drag for that. When the market only has coarser data that far back, a note like Data 1H says so.
Your orders show as Buy and Sell pills on their price lines, your position as a line at your average price, and your fills as ▲ You and ▼ You bubbles.
Using it
Orders on the chart
Hover the price scale and a + appears at the cursor's price. Click it to start a limit orderLimit orderAn order to buy or sell at your price or better. Whatever doesn't fill right away waits in the book. there: a buy below the last price, or a sell of your shares above it. Set the size and send it as a GTCGTCGood 'til cancelled: a limit order that stays in the book until it fills or you cancel it. order.
Drag an order pill to move it; it's cancelled and re-posted at the new price, so it loses its place in the queue. The ✕ on the pill cancels it.
Exits from your position line
Drag the TP or SL handle off your position line to set a take-profitTake-profitAn exit rule that sells your position when the price rises to a level you set, to lock in the gain. or stop-lossStop-lossAn exit rule that sells your position when the price falls to a level you set, to cap the loss. at that price. These are the same Auto-Exit rules as in the Betslip, shown as TP and SL pills you can drag.
The ✕ on your position line sells the whole position at market straight away.
Price alerts
The bell next to the + opens the same New alert editor as in Alerts, already set to a price alert at that level and on the right side of the price. Pick App or TG and save. Your alerts show on the chart as dashed lines with ↑ or ↓. Drag one to move its price, and manage them all in Alerts.
With other widgets
- The Chart follows its colour's market and outcome. Switch Yes/No in the Betslip and the candles flip with it.
- Orders you place here show up in the Orderbook, Ladder and Orders, and the other way round.
Tips
- Set exits where you can see the levels: open a position from the Betslip, then drag TP and SL off its line to the recent high and low. Turn on High / low in Layers, the toolbar menu for what's drawn, and they're marked for you.
- Use 1m or 5m candles with Live ticks for in-play sports and crypto windows, and 1H or 1D to read a slow political market.
Finish reading to complete this lesson
Extras
Layers
Layers in the toolbar picks what's drawn. Under Your trading: Positions, Orders and My trades. Under Market: Bid / Ask and spread, Large wallet trades from a minimum size, and trades by your Saved traders. Large wallet trades is a quick way to see where big money bought or sold.
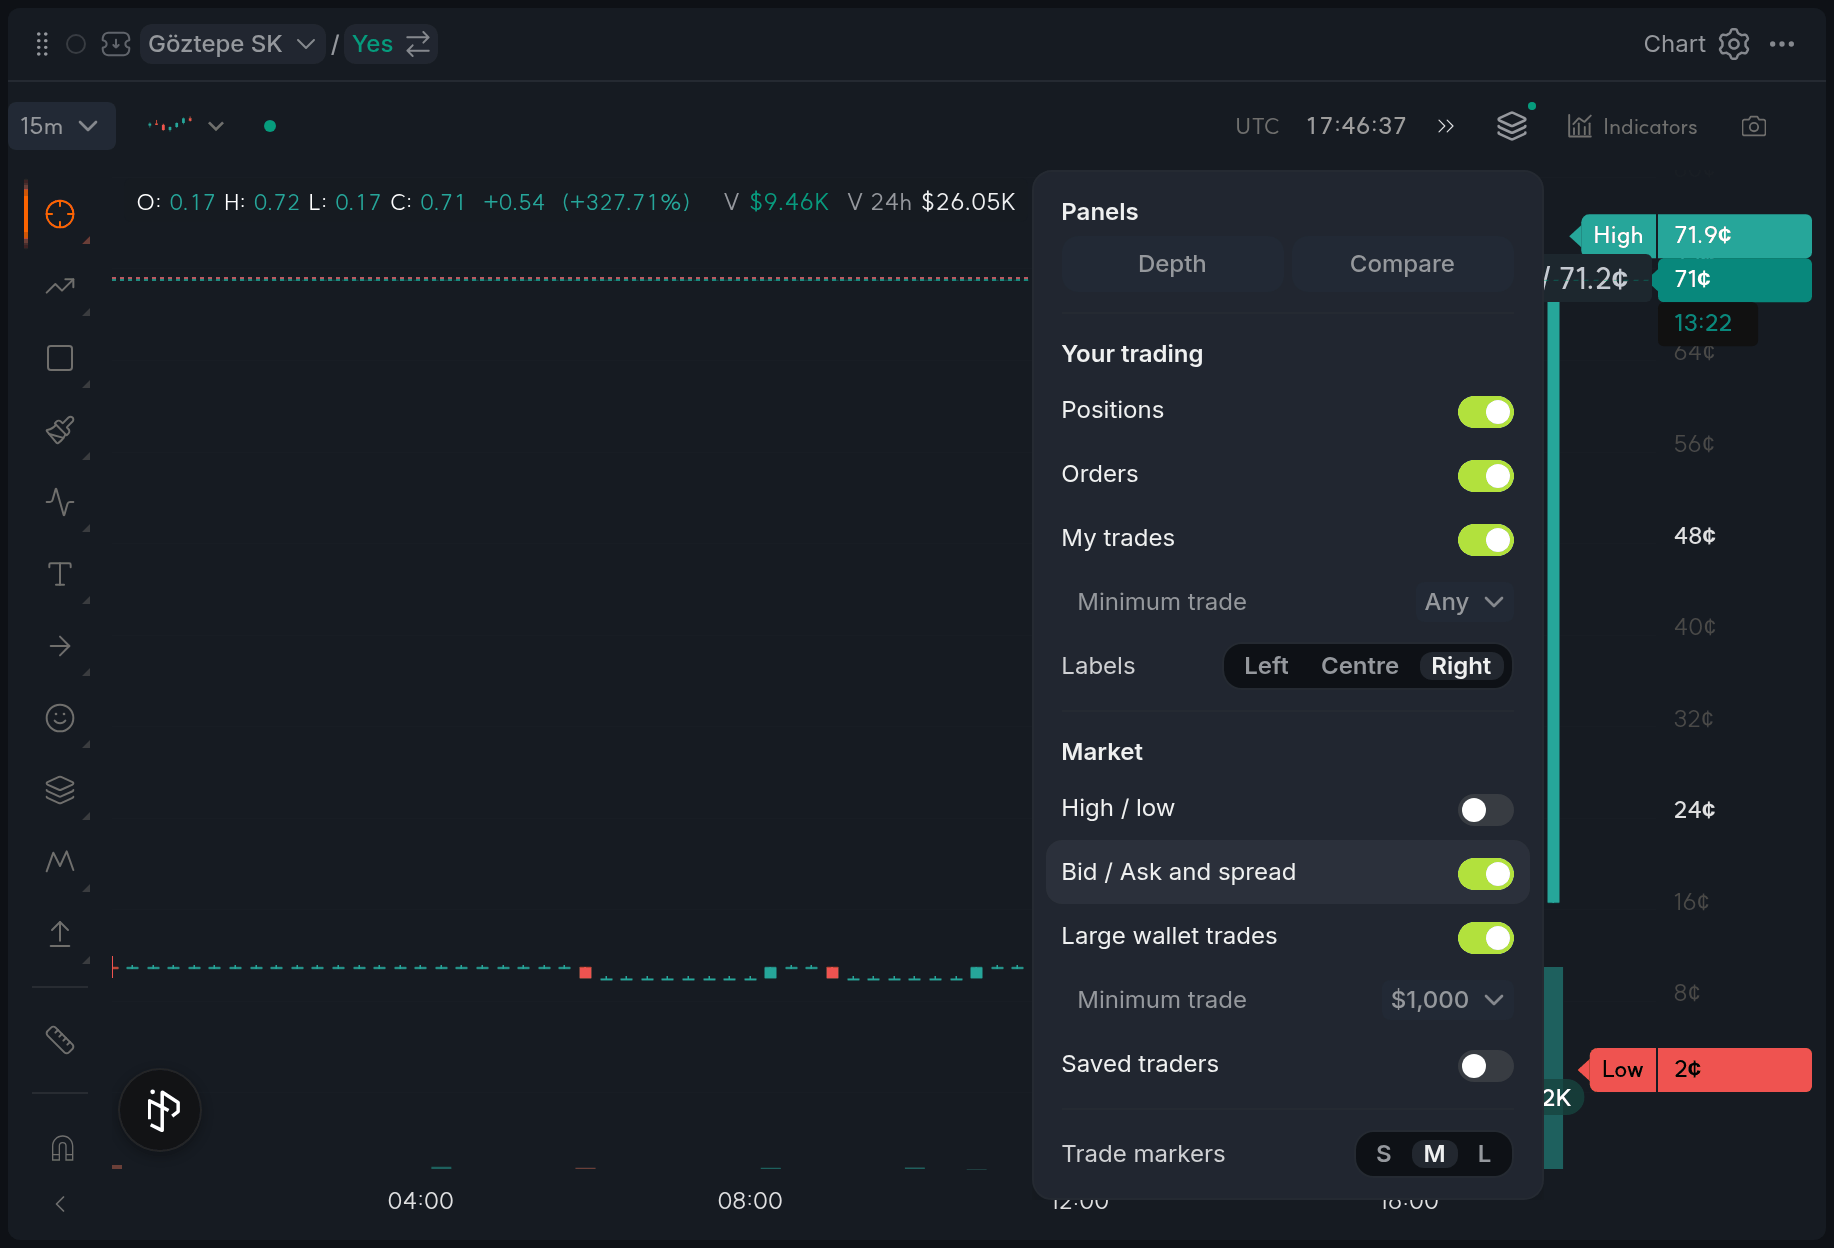
- 1Your trading
- 2Market
- 3Large wallet trades, $1,000 minimum
- 4A large trade bubble
Panels
Layers also opens two panels: Depth shows the top 8 levels of the current book on each side, and Compare draws the Yes and No price histories together on a 0–100¢ scale.
Crypto Up/Down markets
On crypto Up/Down markets a Coin / Market switch sits above the chart. Coin charts the coin itself against the price to beat; Market is the regular outcome chart. A strip next to it shows the time left, the price to beat and where the coin sits against it. Once a window ends, Live window jumps to the current one.
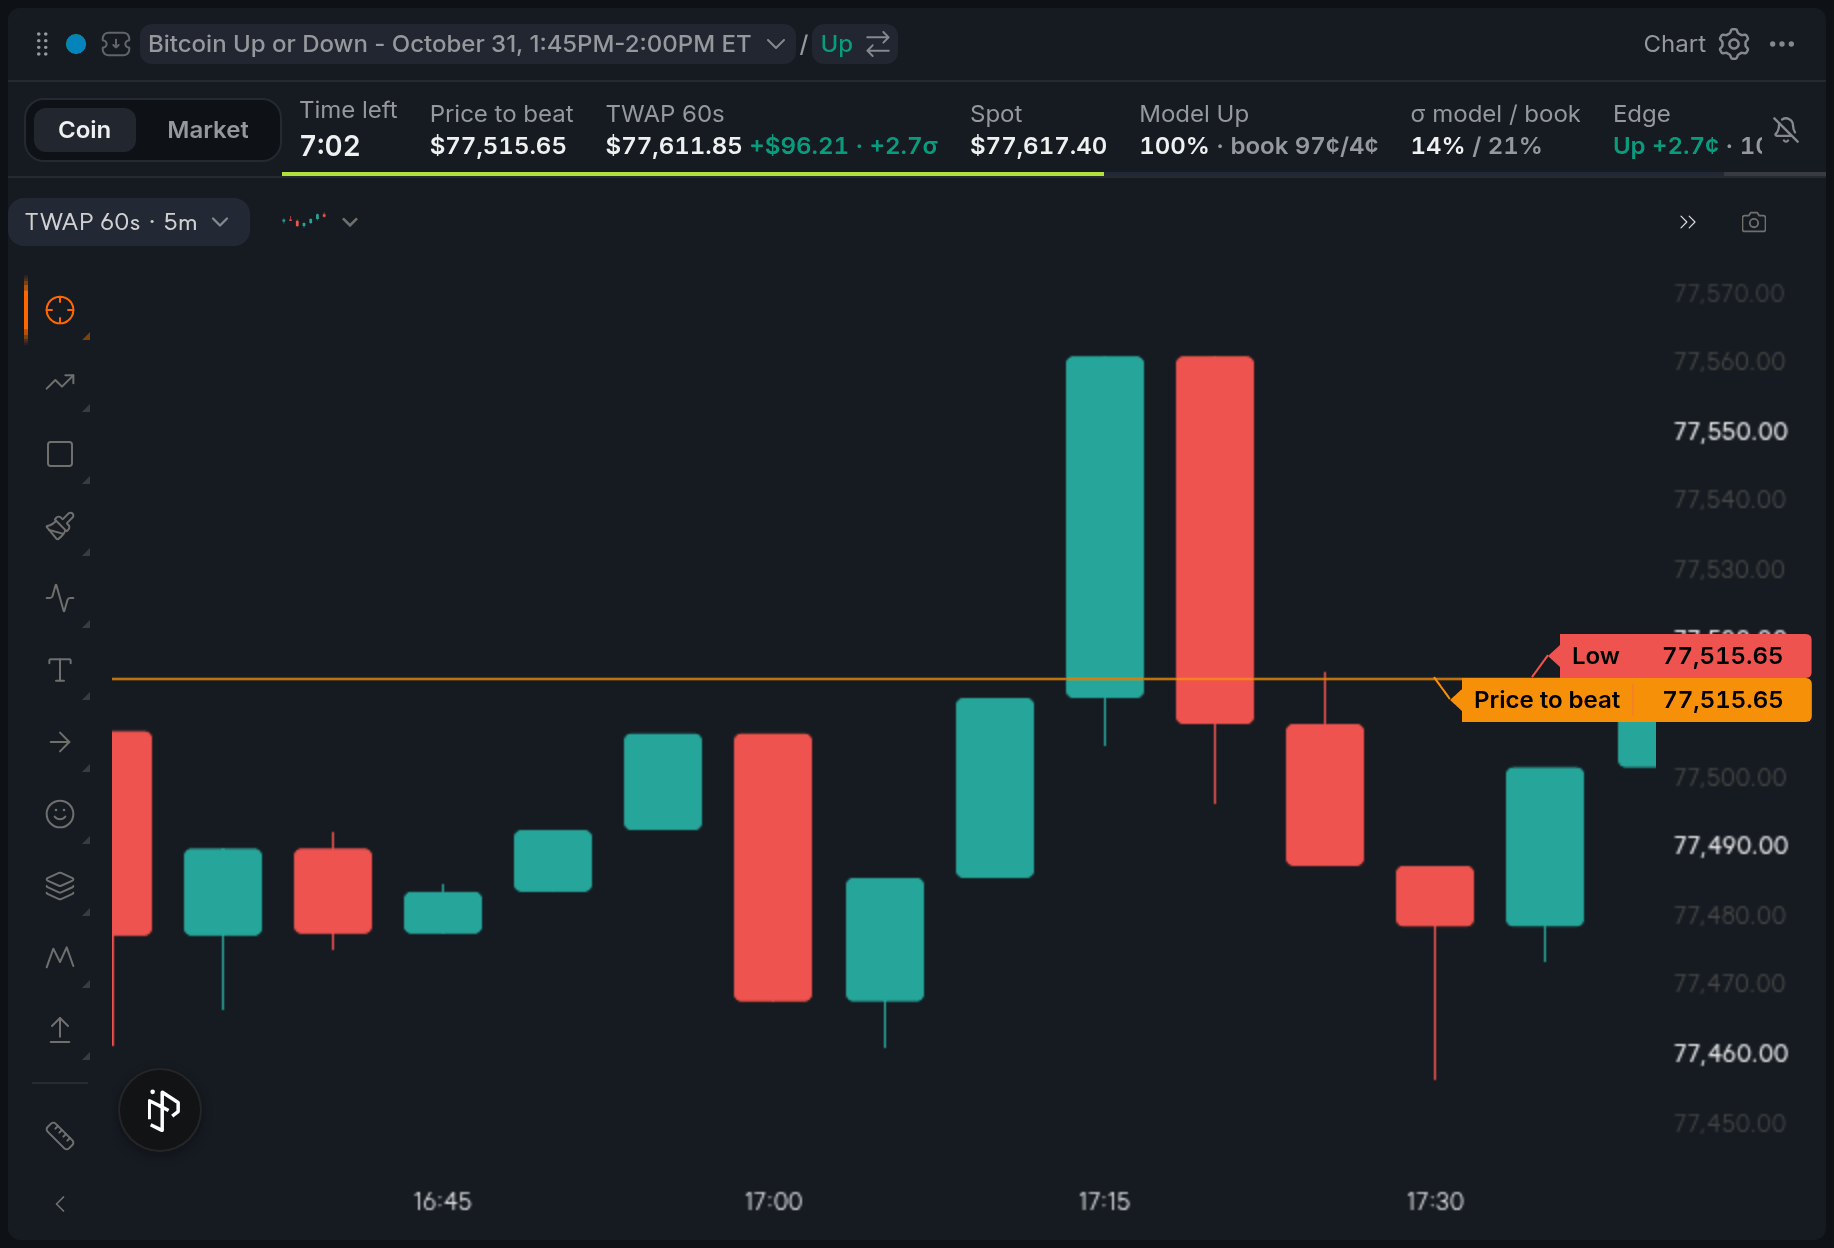
- 1Coin / Market switch
- 2Price to beat
- 3Time left
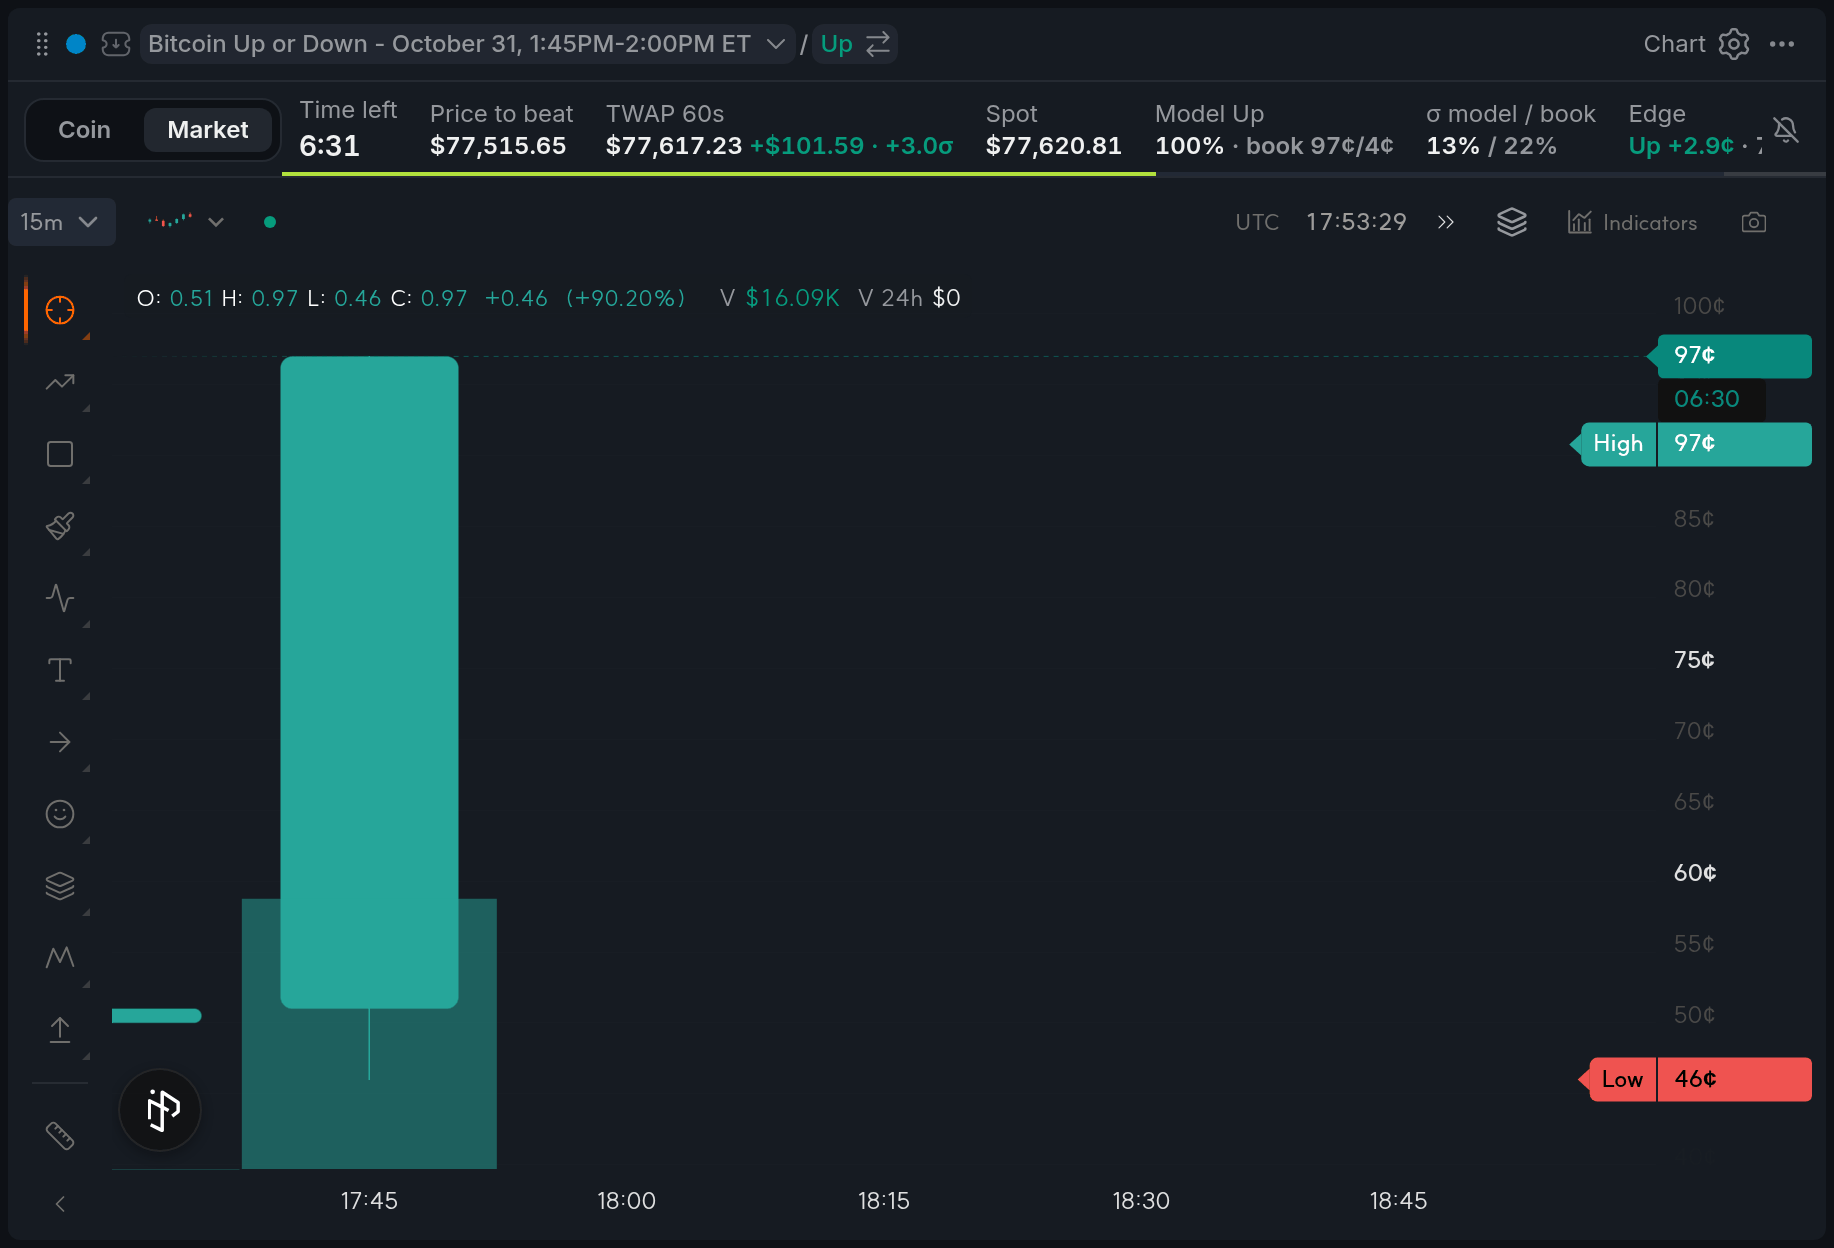
Toolbar
The toolbar also has the plot type, indicators, a screenshot button, a timezone picker and a button that jumps back to the latest bar. Your drawings are kept per market.
Settings
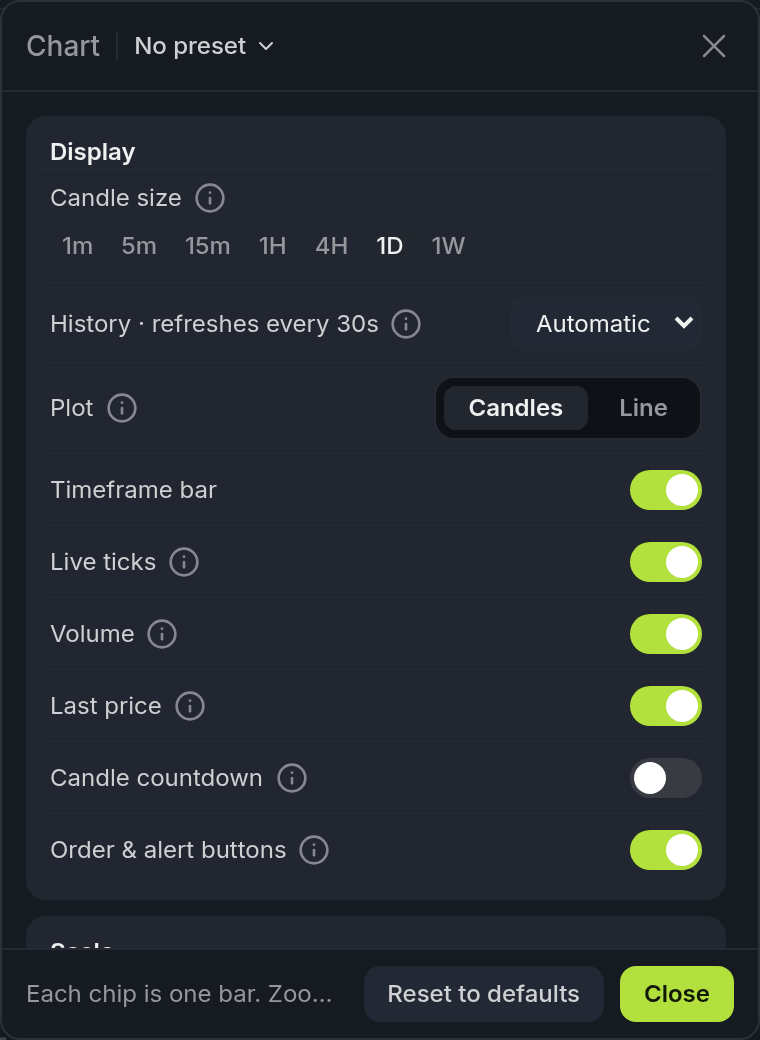
- 1Candle size
- 2Live ticks
- 3Order & alert buttons
| Setting | What it does |
|---|---|
| Candle size | How long one bar is. |
| History · refreshes every 30s | How much history loads. Automatic picks it from the candle size. |
| Plot | Candles or Line. Line is the close of each bar. |
| Timeframe bar | Shows or hides the candle chip. |
| Live ticks | Updates the last candle on every trade. Off: candles refresh every 30 seconds. |
| Volume, Last price, Candle countdown | Volume bars, a line at the last trade, and the time left in the current candle. |
| Order & alert buttons | The + and bell at the cursor price. |
| Scale | Linear or Log, plus price and time grid lines. |
| Drawings | Turn Show off to hide them without deleting; Lock stops them moving while you trade. |
| Advanced | The chart engine's own options, such as colours. |
In the Layers menu you also set Highs & lows (Levels or Swings), the size of trade markers, and where position and order labels sit on their lines.