Chapter 2 · Discovery · Lesson 3 · 3 min
Weather List
Every city's temperature market for one day, with what the station has recorded and where the day is heading.
Weather List puts every city's daily temperature market on one screen, so you can see where the station stands and which bracketBracketOne range of values in a market with many options, like "24–25°C" in a city's temperature market. Each bracket trades as its own Yes/No market. leads. Click a city and the widgets in its colour switch to it.
What you see
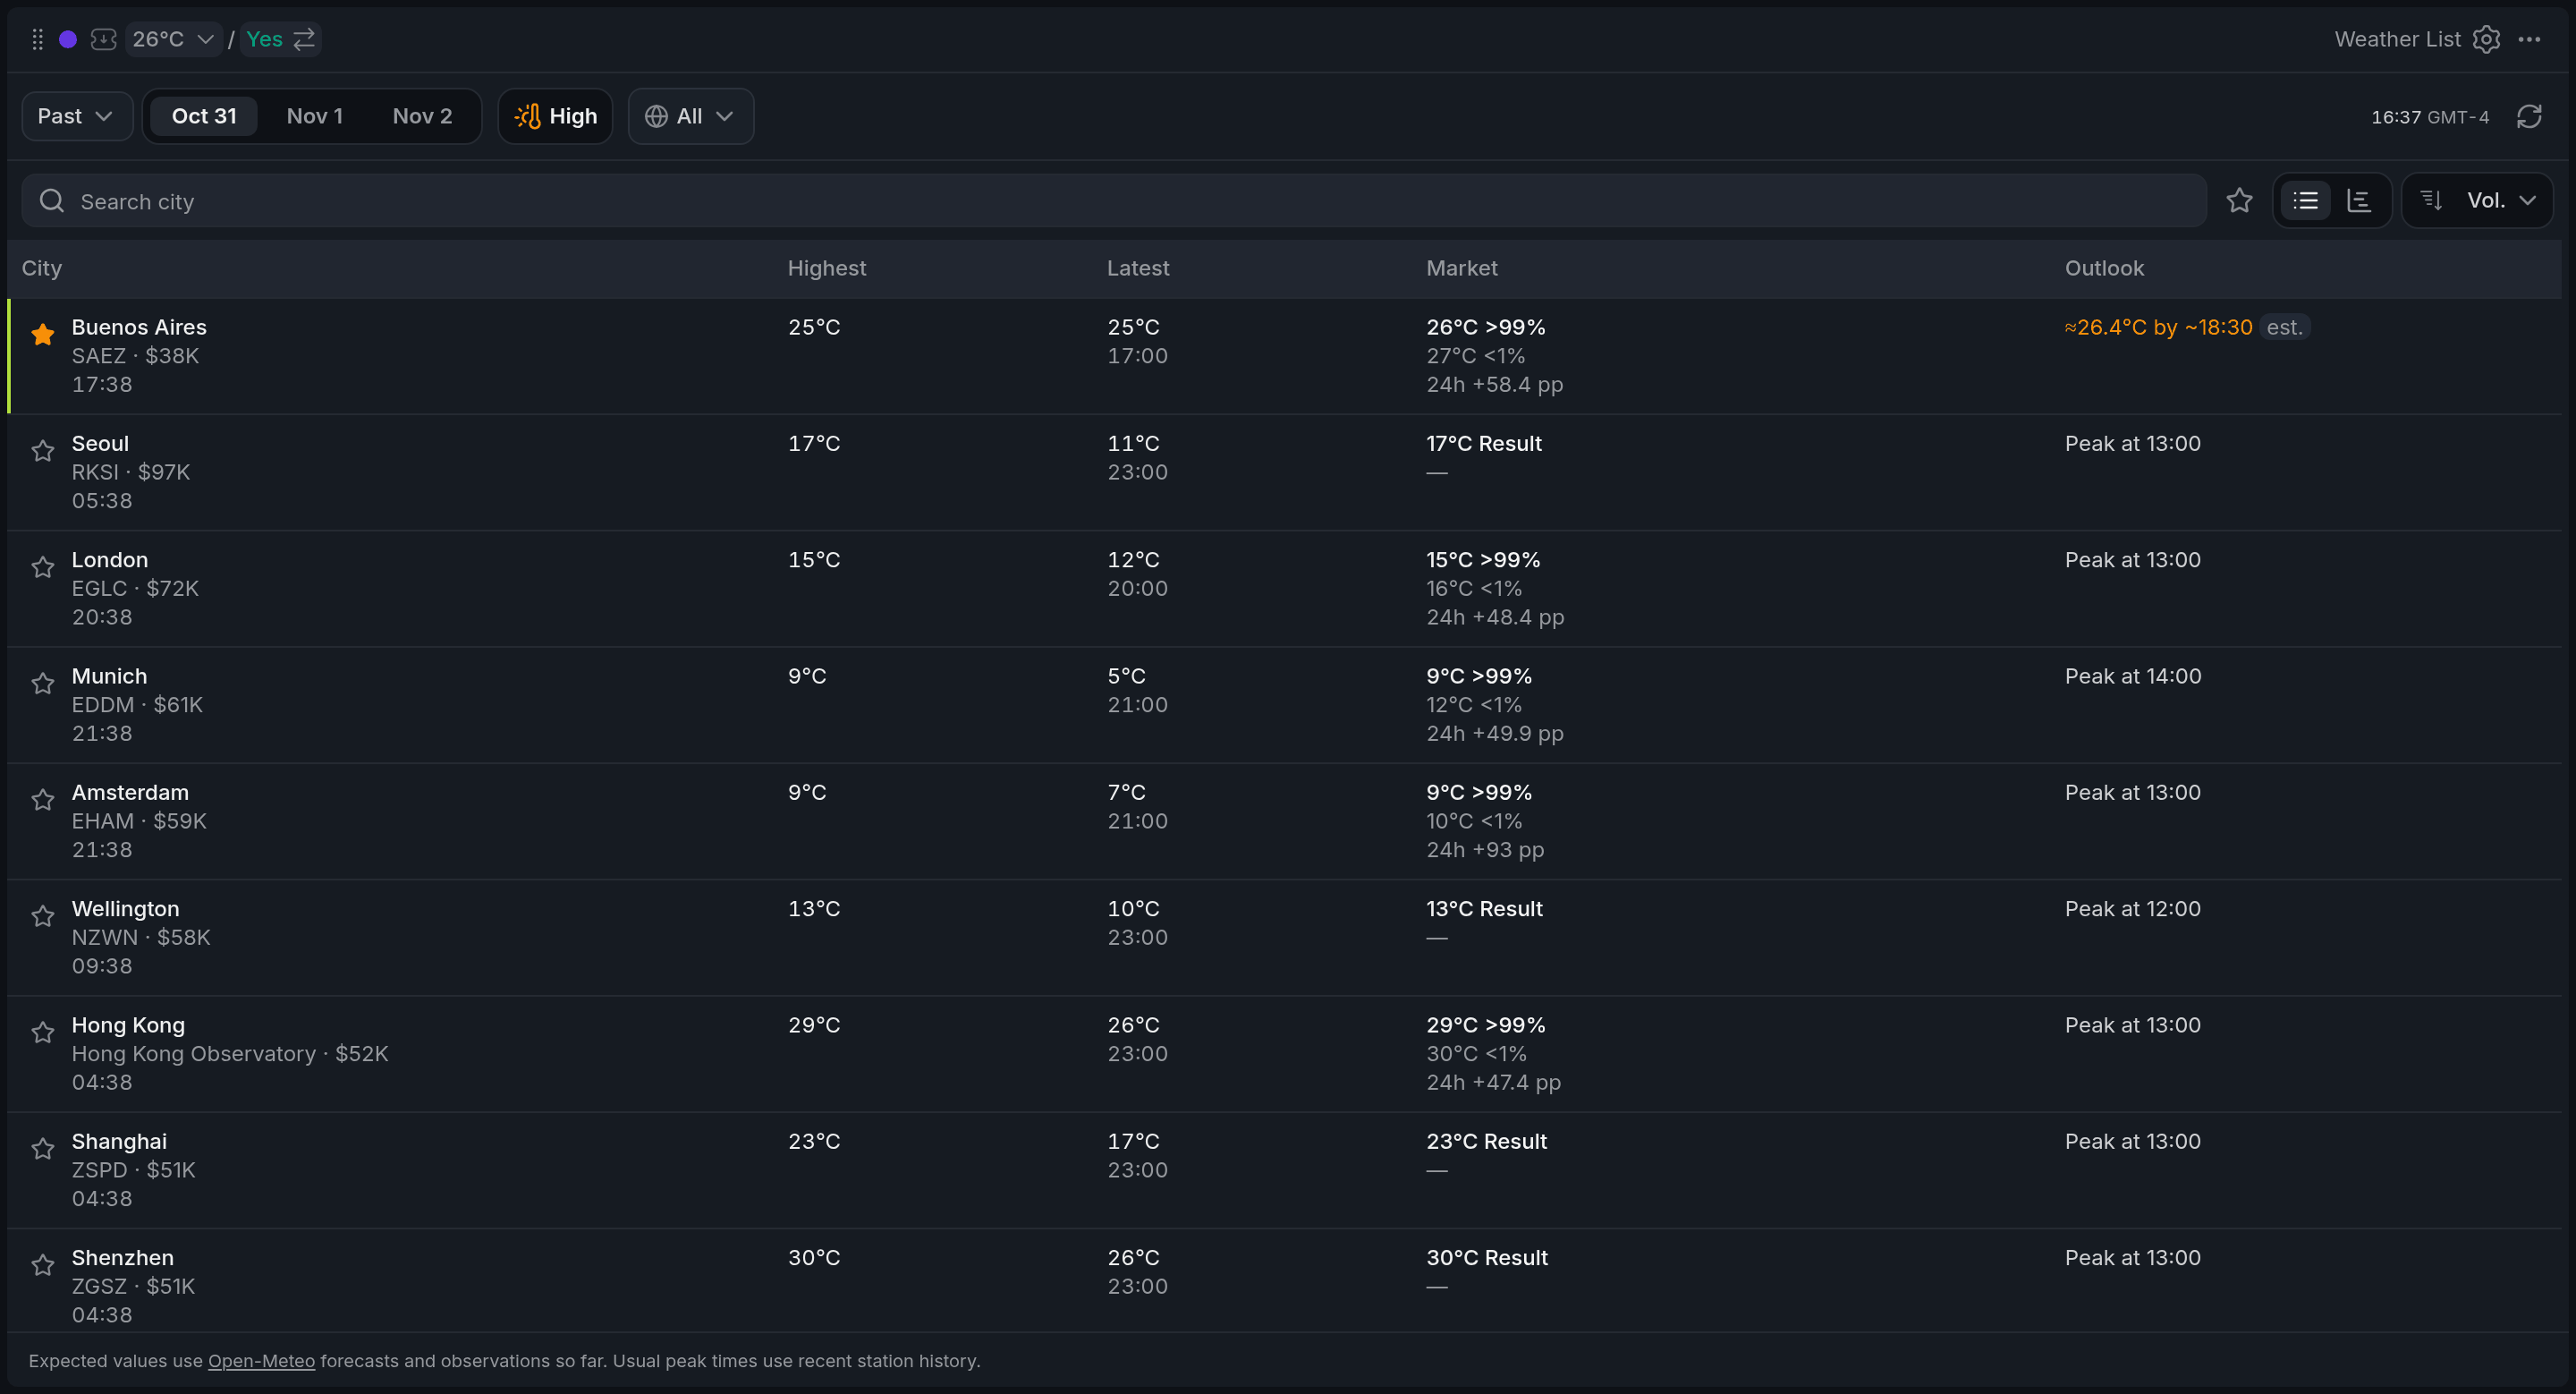
- 1Highest so far
- 2Latest report and its time
- 3Leading bracket, runner-up, 24h move
- 4Outlook with est. tag
- 5Past, date chips and High/Low
Each row shows the station's high so far, its latest report, the leading bracket with its chance, and the outlook. Temperatures come from the station the market settles on, in the market's own unit.
≈31°C by ~15:00 with an est. tag is the expected extreme, from the Open-Meteo forecast and the reports so far. Peak at 14:20 or Likely peaked · 14:20 means the high is probably in. Usually peaks ~15:00 comes from the station's recent history when there's no forecast.
Using it
Pick the day and the metric
The date chips switch between today and the next two days, and Past opens the last two weeks of settled days. The High / Low button flips the list between highest and lowest temperature markets.
Timeline: see when each city peaks
Switch the view to Timeline for one scale per city, in the station's local time. It shows at a glance which cities are done and which still have hours to move.
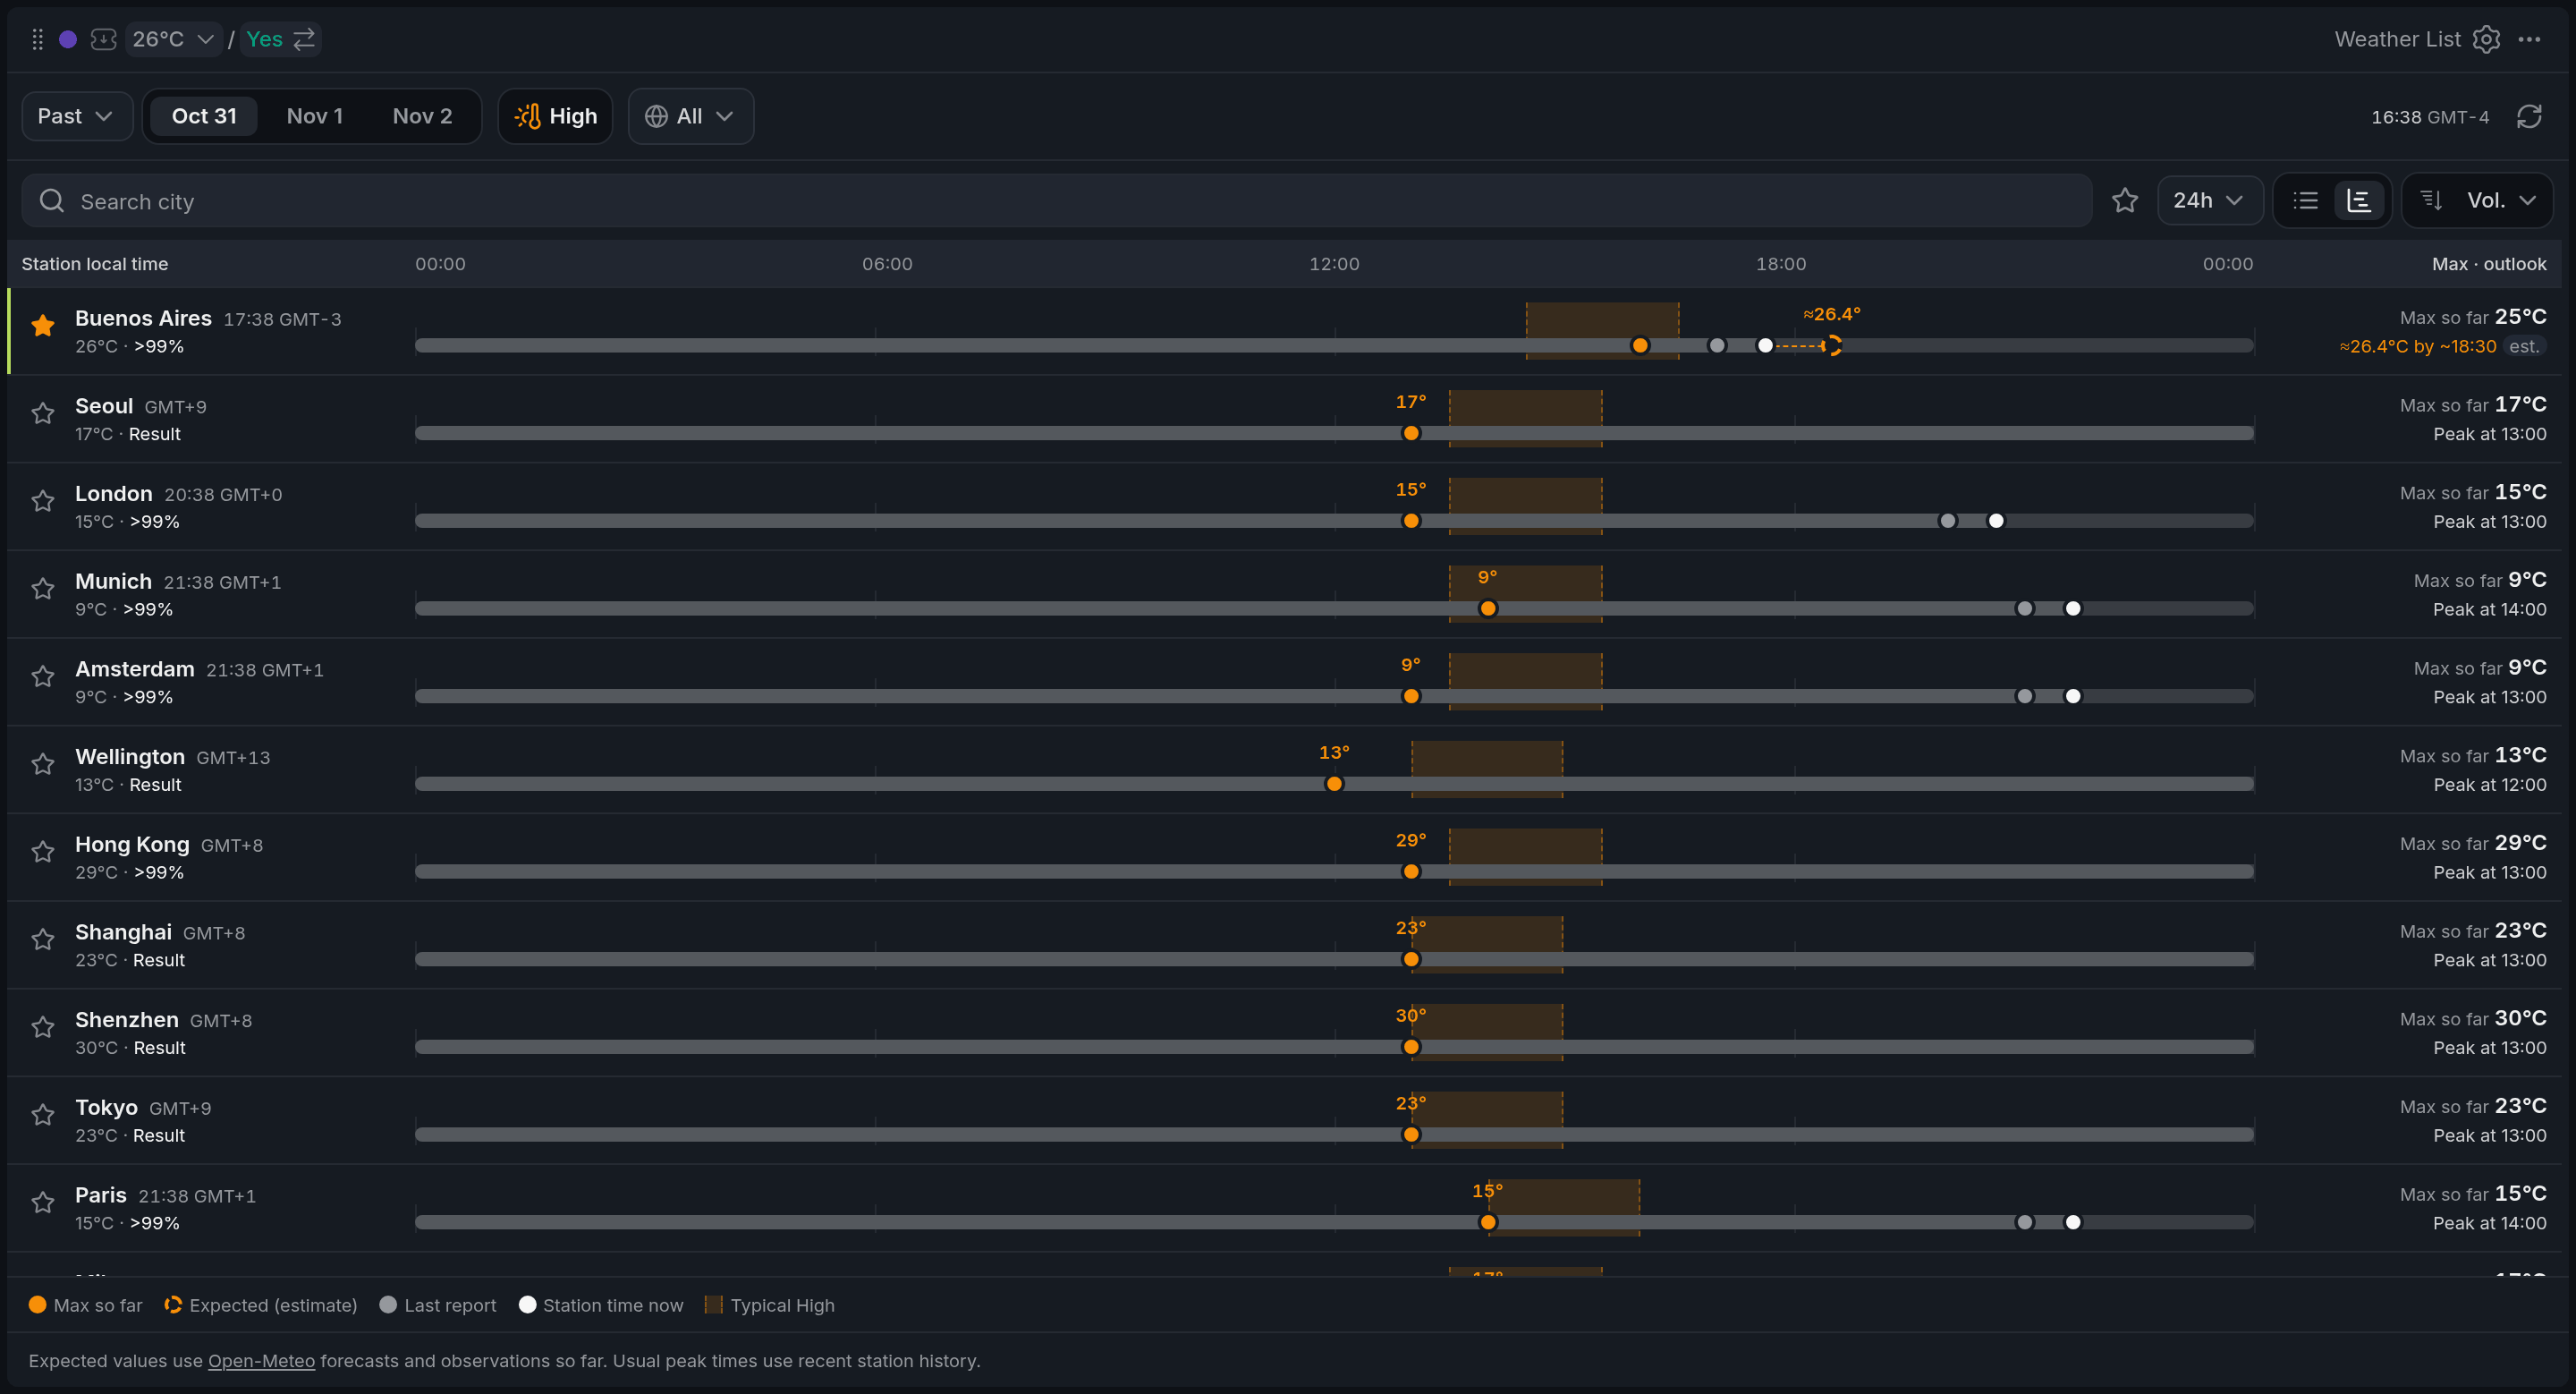
- 1Station time now
- 2Max so far
- 3Expected peak, dashed
- 4Usual peak zone
- 524h, 12h or 6h window
The 12h and 6h windows zoom in on the afternoon for highs, and on night to morning for lows.
Expected values and usual peak times are estimates. The market settles on the station's own reports, so check those before you trade on an outlook.
Pin, filter and sort
Star a city to keep it at the top on every day, and use the toolbar star to show only those. The globe button filters by continent or country.
Sort by Local day end to put the cities whose day finishes first at the top.
With other widgets
- Click a city and its colour switches to that market, on the leading bracket. Weather Details then shows its chart and every bracket.
Tips
- Put Weather List, Weather Details and a Betslip in one colour: scan, click a city, check the curve, trade.
- As a city's clock nears its usual peak, switch the Timeline to 6h. The afternoon fills the scale, so you see how far the max so far sits from the expected peak.
- Trade by time zone: bookmark the continents you follow in the globe menu and switch between them through the day.
Finish reading to complete this lesson
Extras
Columns
| Column | What it tells you |
|---|---|
| Highest / Lowest | The extreme the station has recorded so far that day. |
| Latest | The most recent report, with its station-local time. |
| Market | The leading bracket and its chance, the runner-up and the 24h move. After settlement, the winning bracket with Result. |
| Outlook | Where the day is heading. |
Layout by width
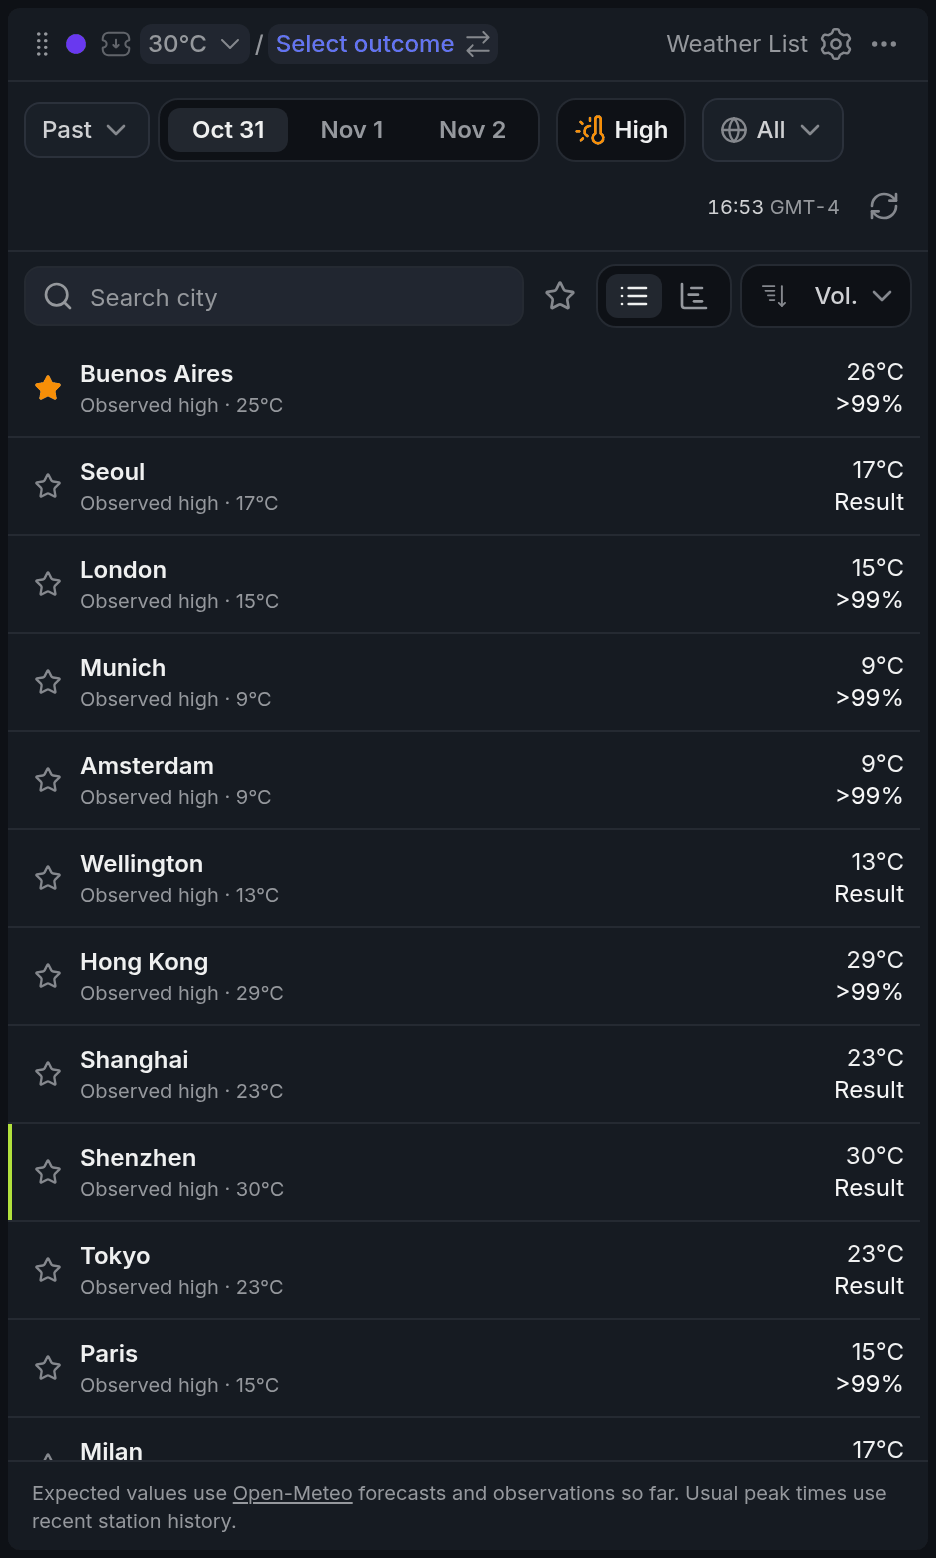
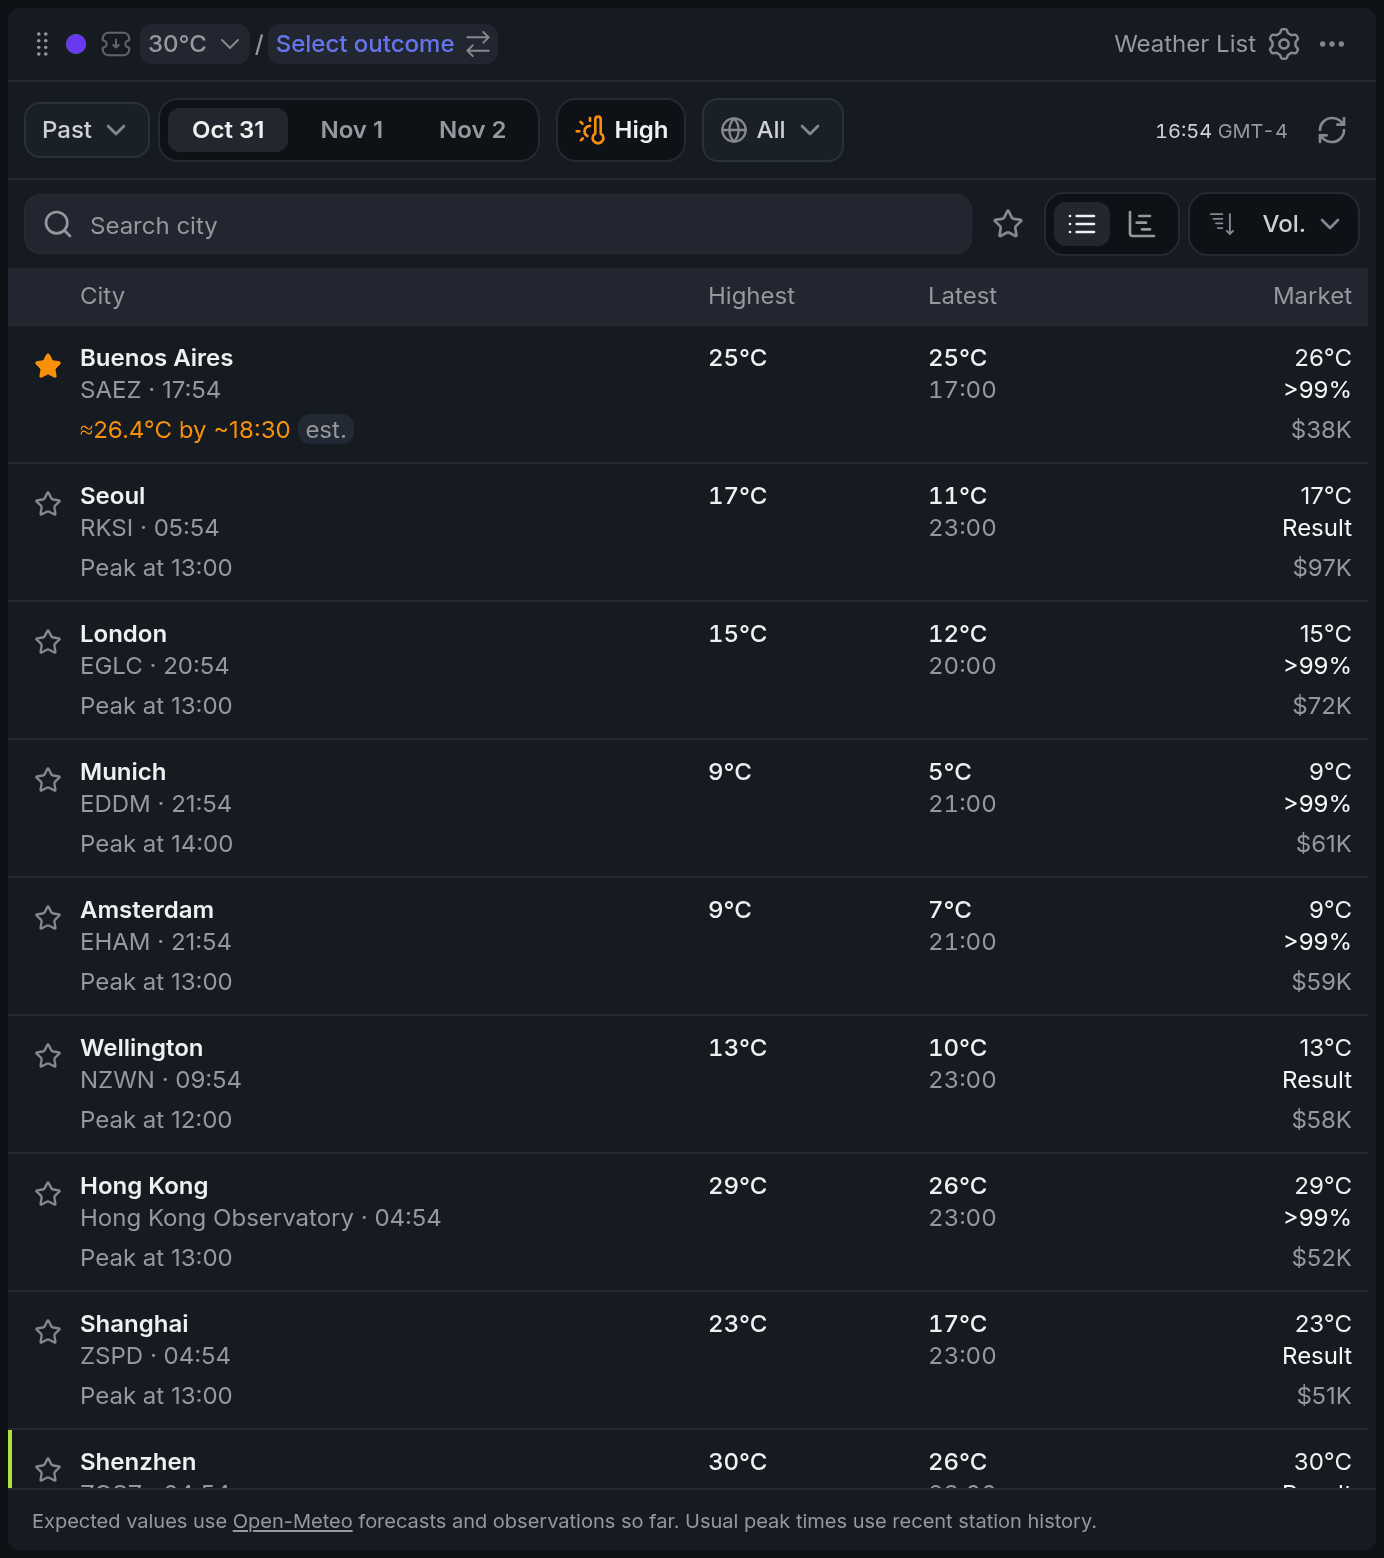
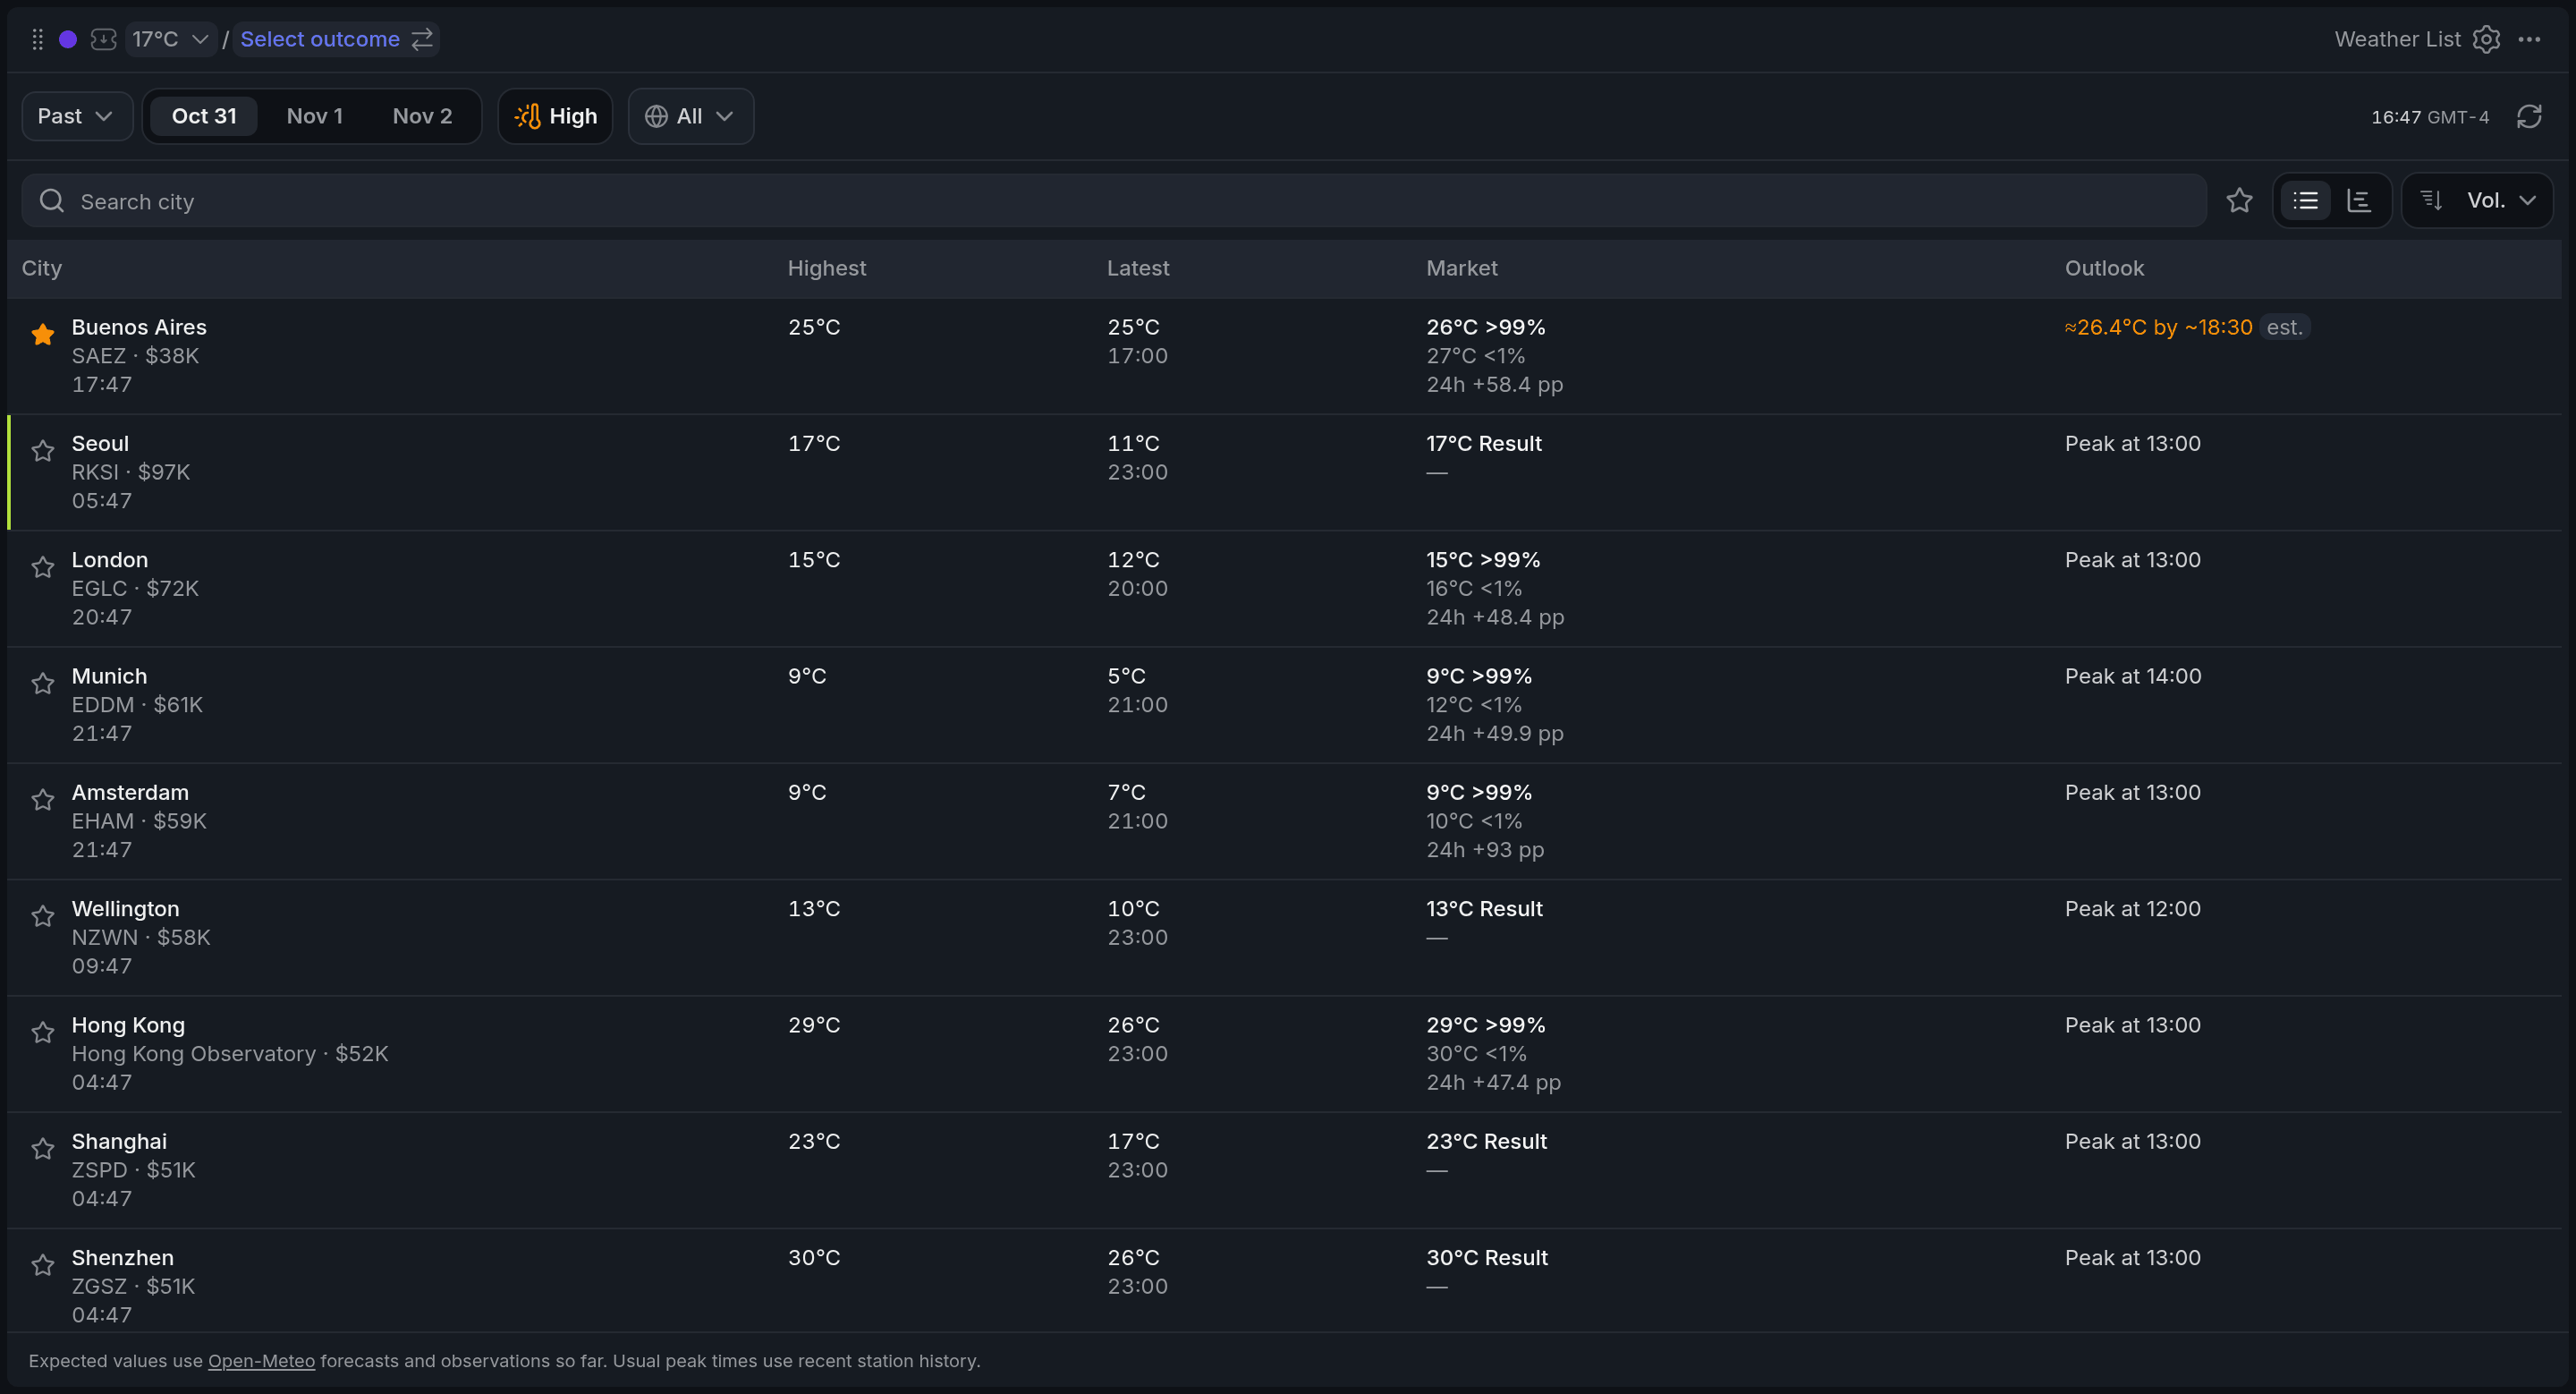
The widget picks its layout from its size.
When there's no outlook
| Status | What it means |
|---|---|
| Report available | The station has reported, but there's no outlook yet. |
| Day ahead | The day hasn't started in that city. |
| No report | No reports have come in for that day. |
| Settled | The market has resolved. |
| Unavailable | Weather data couldn't be loaded. Try the refresh button. |
Location filter
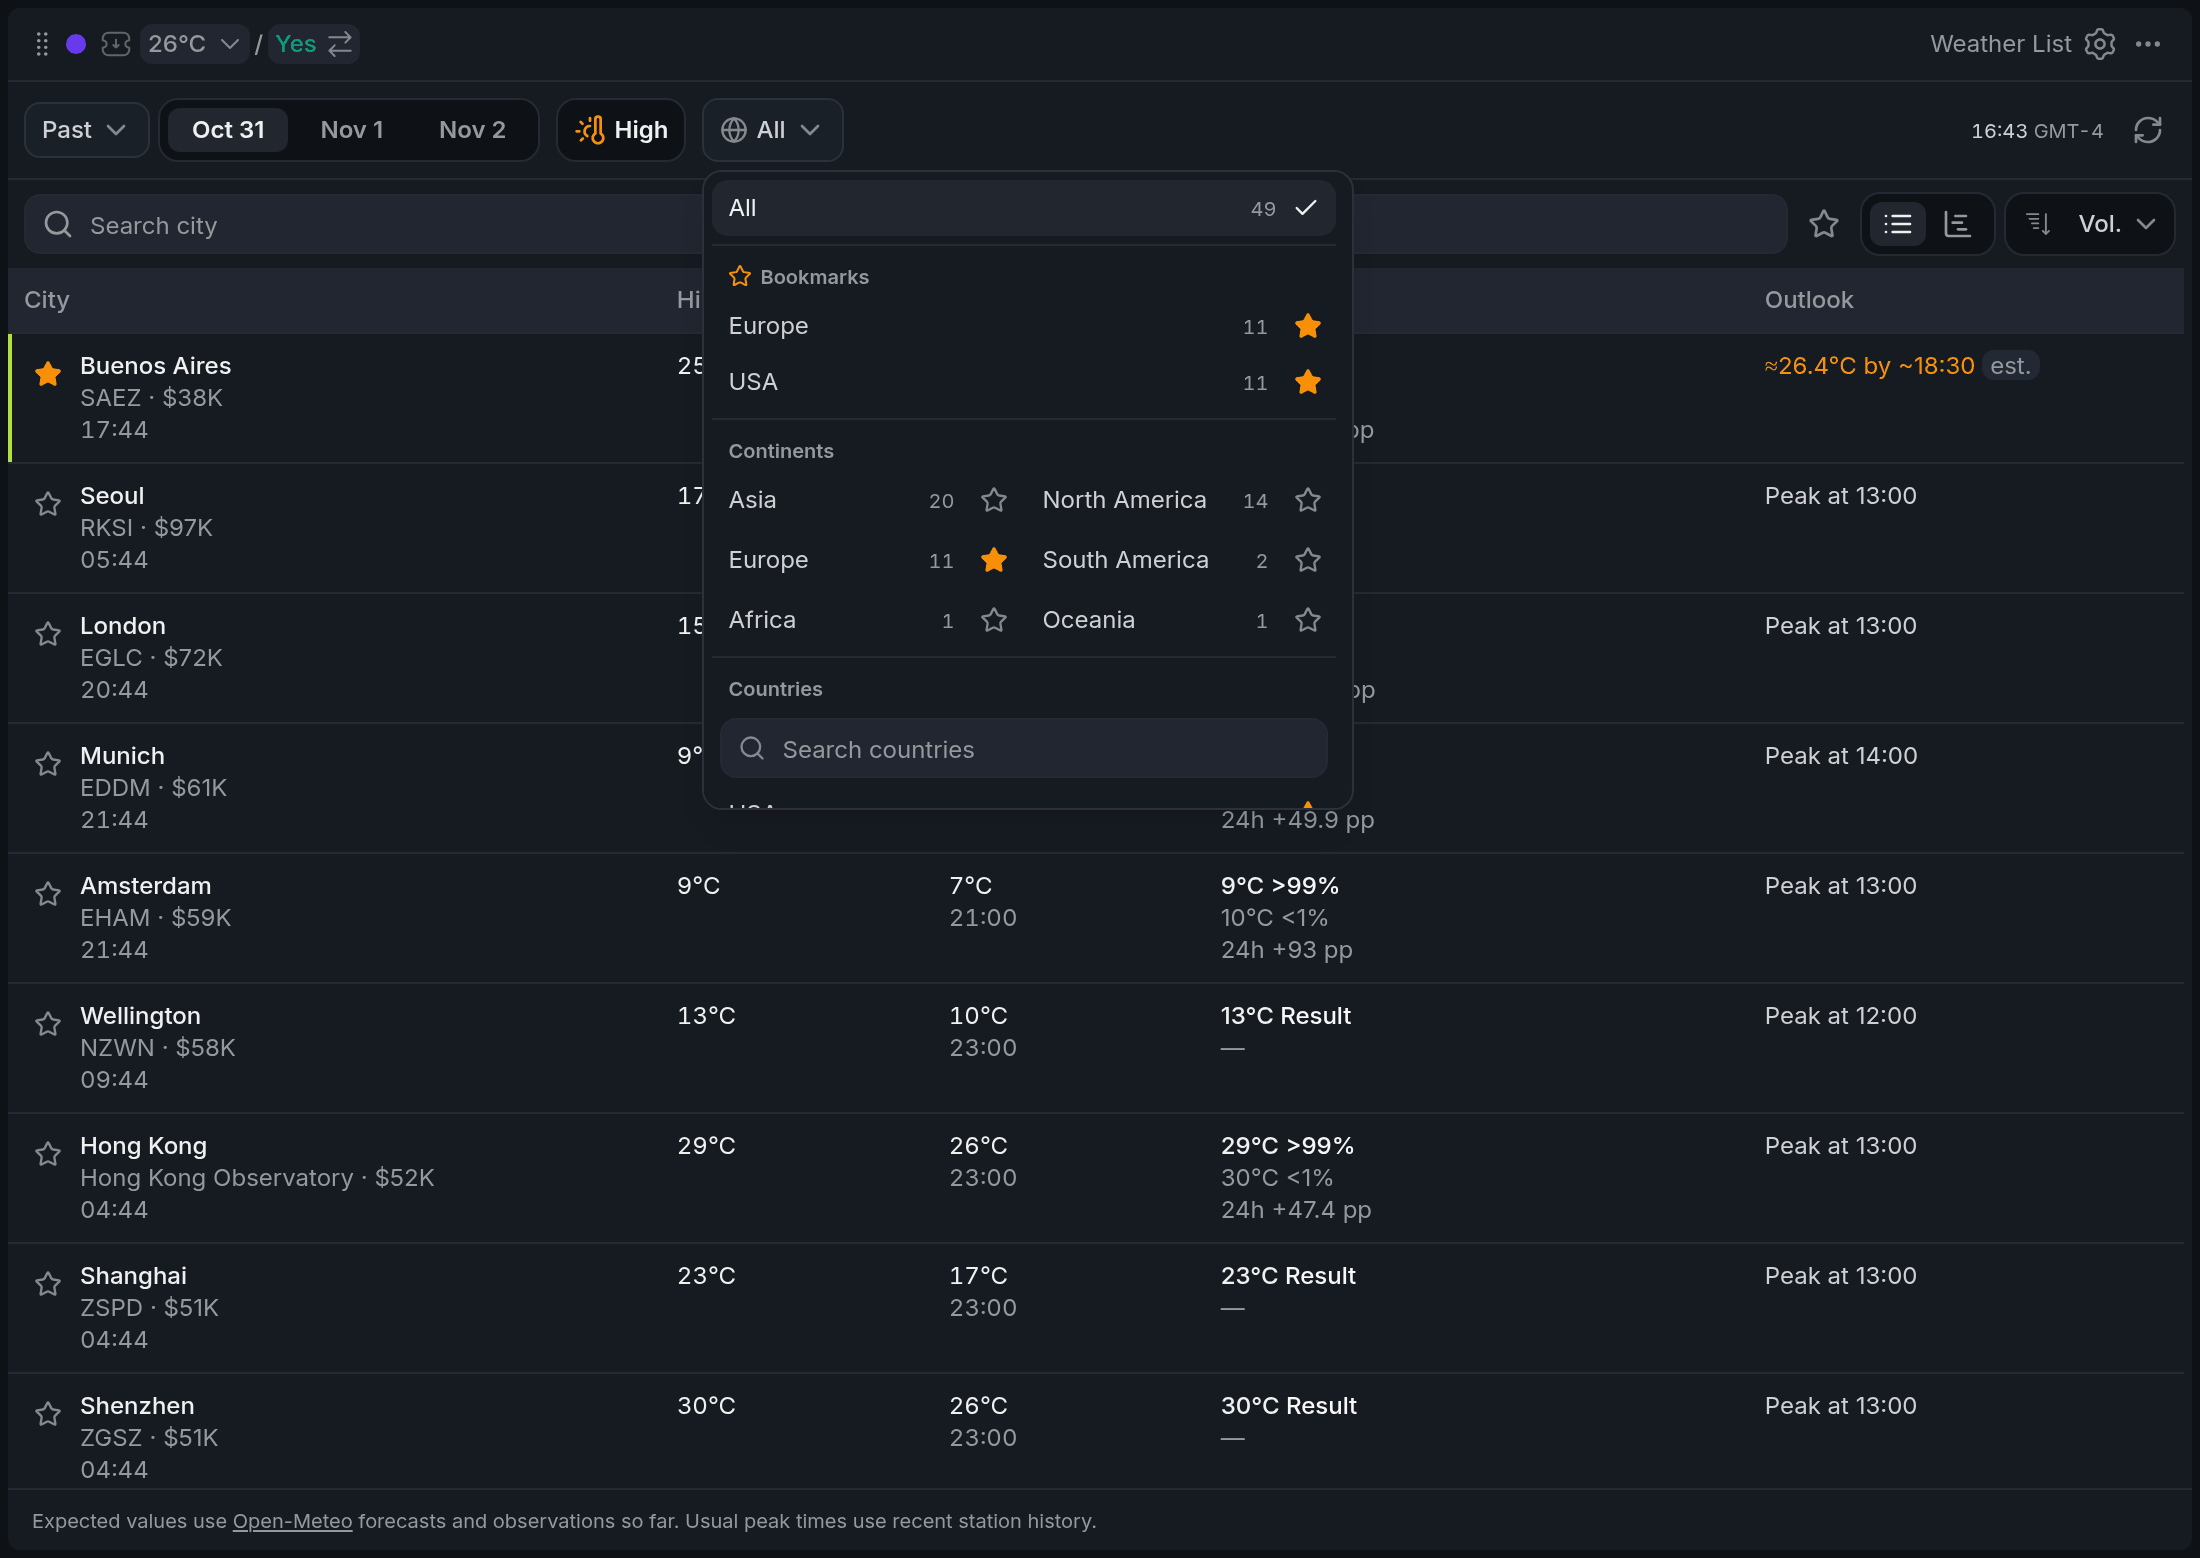
- 1Bookmarks: your starred groups
- 2Continent with its city count
- 3Search countries
Each continent and country shows how many cities it has that day. Star the ones you check often and they move to Bookmarks at the top.
Settings
| Setting | What it does |
|---|---|
| Temperature metric | Highest or Lowest, same as the toolbar button. |
| Sort cities | Volume, City or Local day end, and the direction. |
| Row spacing | Auto, Compact or Comfortable. |