Chapter 4 · Analysis · Lesson 11 · 3 min
Weather Details
One city's temperature market up close, with station readings, the day's curve and every bracket's price.
Weather Details shows one city's temperature market up close: the station's readings, the day's curve and every bracketBracketOne range of values in a market with many options, like "24–25°C" in a city's temperature market. Each bracket trades as its own Yes/No market. at live prices. It shows one market, so link it to a colour group, usually the same one as your Weather List.
What you see
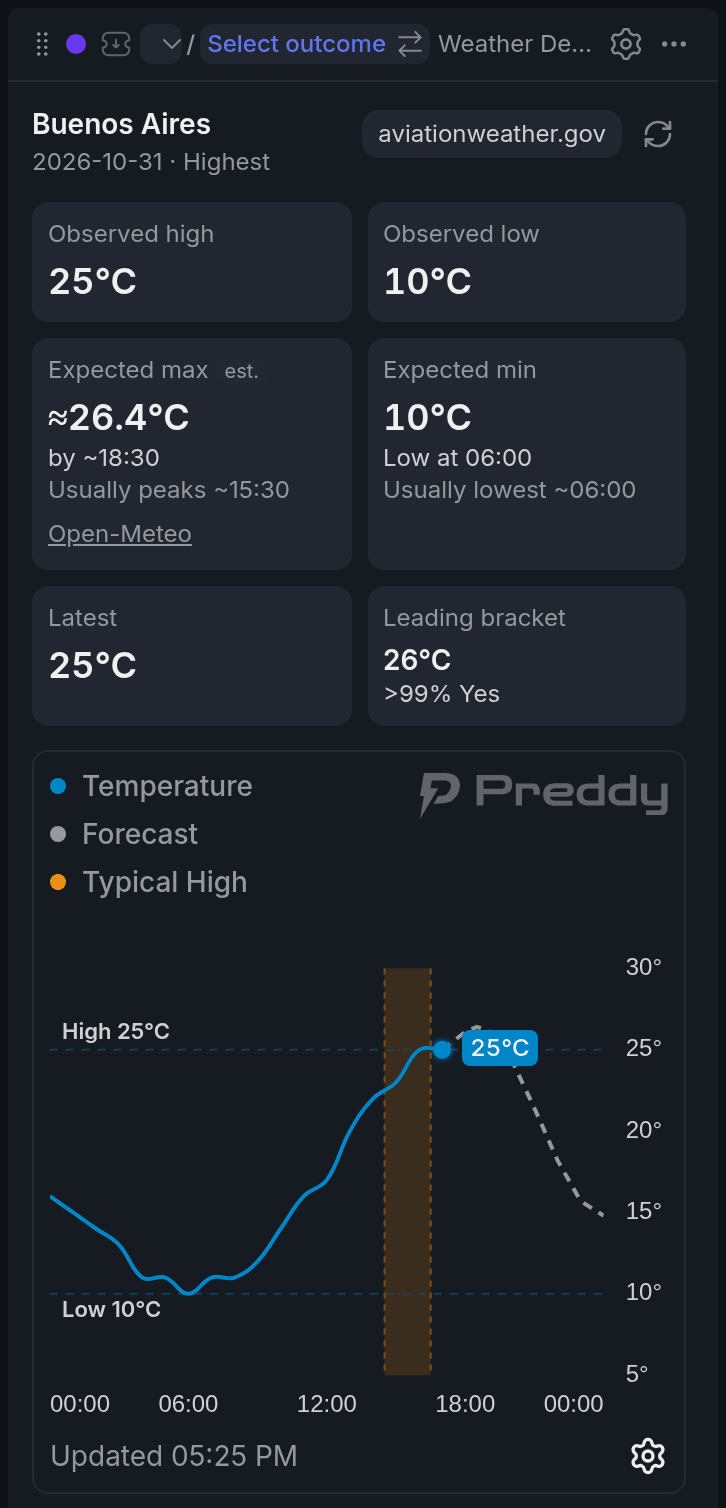
- 1Observed high and low
- 2Expected max with est. tag
- 3Leading bracket and its chance
- 4Dashed Open-Meteo forecast
- 5Typical High band
The cards at the top hold the station's high and low so far, the expected max and min, the latest report and the leading bracket with its chance. The expected cards read the same way as the Outlook in Weather List. Temperatures are in the market's own unit.
On the chart, the solid line is the station's reports and the dashed line is the Open-Meteo forecast. The shaded band marks the hour either side of when the high (or low) usually lands. Hover to read the values at any time.
Using it
Trade from Market prices
Market prices lists every bracket in temperature order, with live Yes and No prices and the 24h move. Click a row to switch the colour to that bracket. Click a price and it also lands in the Betslip as a limit priceLimit orderAn order to buy or sell at your price or better. Whatever doesn't fill right away waits in the book.. Nothing is placed until you submit it there.
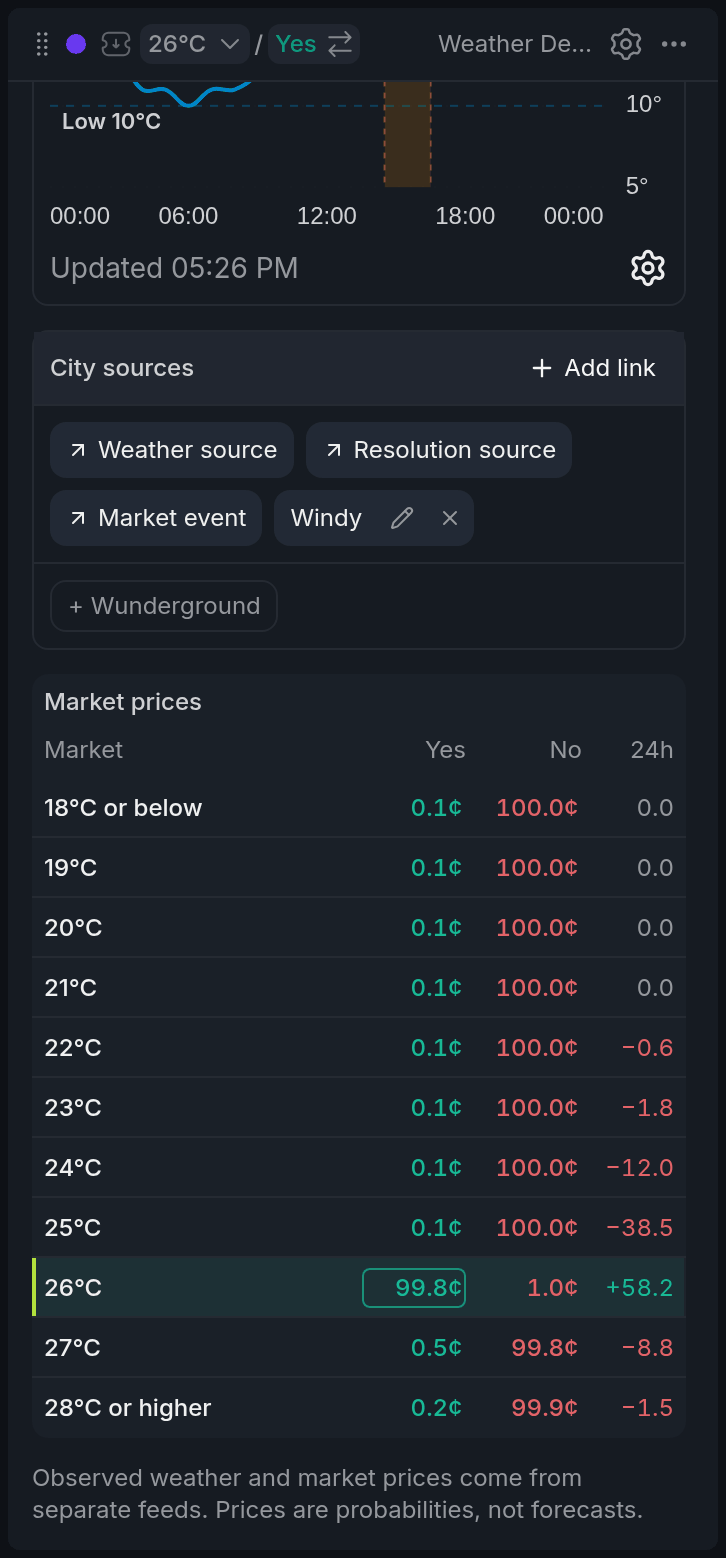
- 1Click a price to fill the Betslip
- 2Selected bracket, accent edge
- 324h move
- 4City sources with Add link
Keep your sources at hand
City sources keeps the pages you check for this city in one row: the Weather source, the market's Resolution source when it's a different page, and the Market event. Add Windy with one click, or press Add link for your own, like a local met office. Each city keeps its own set.
With other widgets
- Click a city in Weather List and Weather Details switches to it. Until its colour holds a temperature market, it asks you to pick one.
- A bracket you click switches the whole colour, so an Orderbook beside it shows that bracket's depth before you trade. A price you click goes to the Betslip.
Tips
- Close to settlement, check the latest reports yourself on the Resolution source in City sources: that's the page the market settles on. (If it's the same page as the Weather source, only Weather source shows.)
- Short on space? Turn off Show temperature chart in settings. You keep the cards, your links and the prices: a compact trading panel next to Weather List.
Finish reading to complete this lesson
Extras
Chart lines
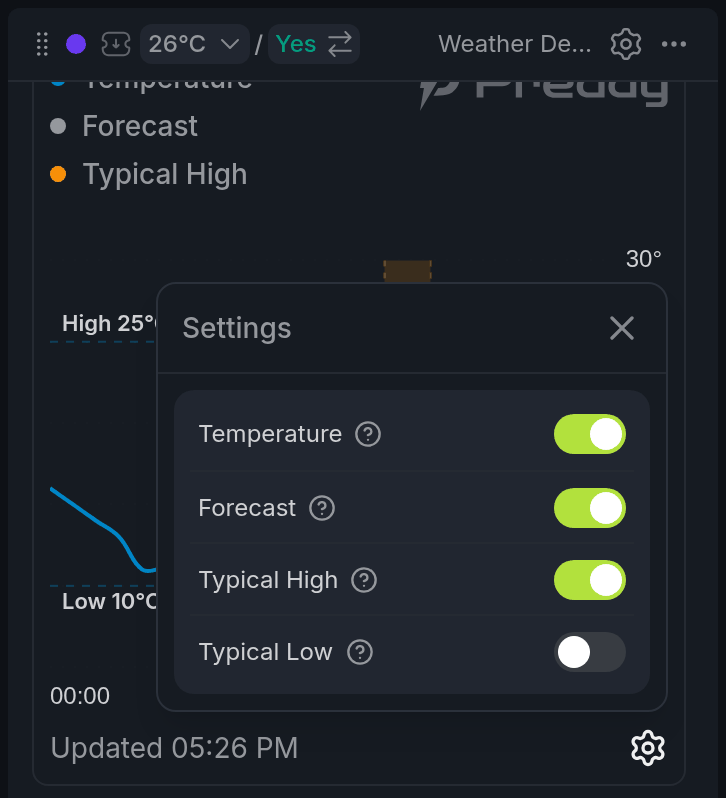
- 1Chart settings button
- 2? explains each line's source
Turn lines on and off from the settings button under the chart.
| Line | What it shows |
|---|---|
| Temperature | The station's reports through the day, with the high and low so far marked. |
| Forecast | The Open-Meteo hourly forecast. It reads Forecast (outdated) when no fresh forecast has come in. |
| Typical High | An hour either side of the station's usual time for the high, from recent days. |
| Typical Low | The same for the low. |
Typical High is on by default for highest markets and Typical Low for lowest ones. The ? next to each line says where its data comes from.
Your own links
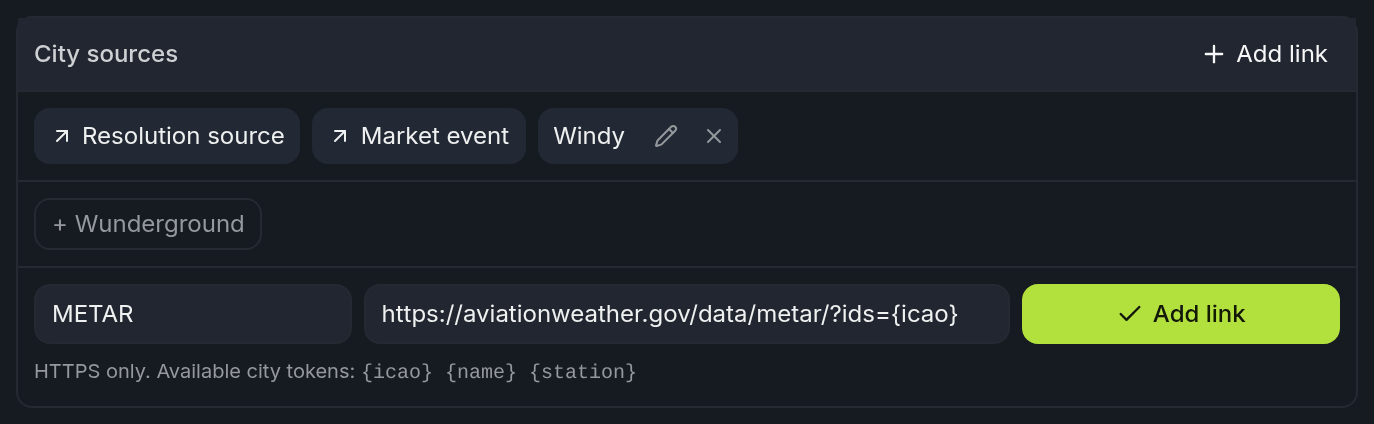
- 1Address with {icao}
- 2City tokens hint
- 3Edit and remove a saved link
Links must be HTTPS. Put {icao}, {name} or {station} in the address and the widget fills in the city's station code (when it's known), name or station. You can keep up to 30 links per city; the pencil edits one and ✕ removes it. When the station code is known, Wunderground joins Windy as a one-click link.
Settings
| Setting | What it does |
|---|---|
| Show temperature chart | Shows or hides the chart. |
| Show market prices | Shows or hides the full bracket list. |