Chapter 4 · Analysis · Lesson 12 · 3 min
Post Counter
One post-count window up close, with the live count, the forecast and a fair price for every bracket.
Post Counter follows one post-count window: the live count, where it's heading, and a fair price for every bracketBracketOne range of values in a market with many options, like "24–25°C" in a city's temperature market. Each bracket trades as its own Yes/No market.. It shows one market, so link it to a colour group, usually the same one as your Post Scanner.
What you see
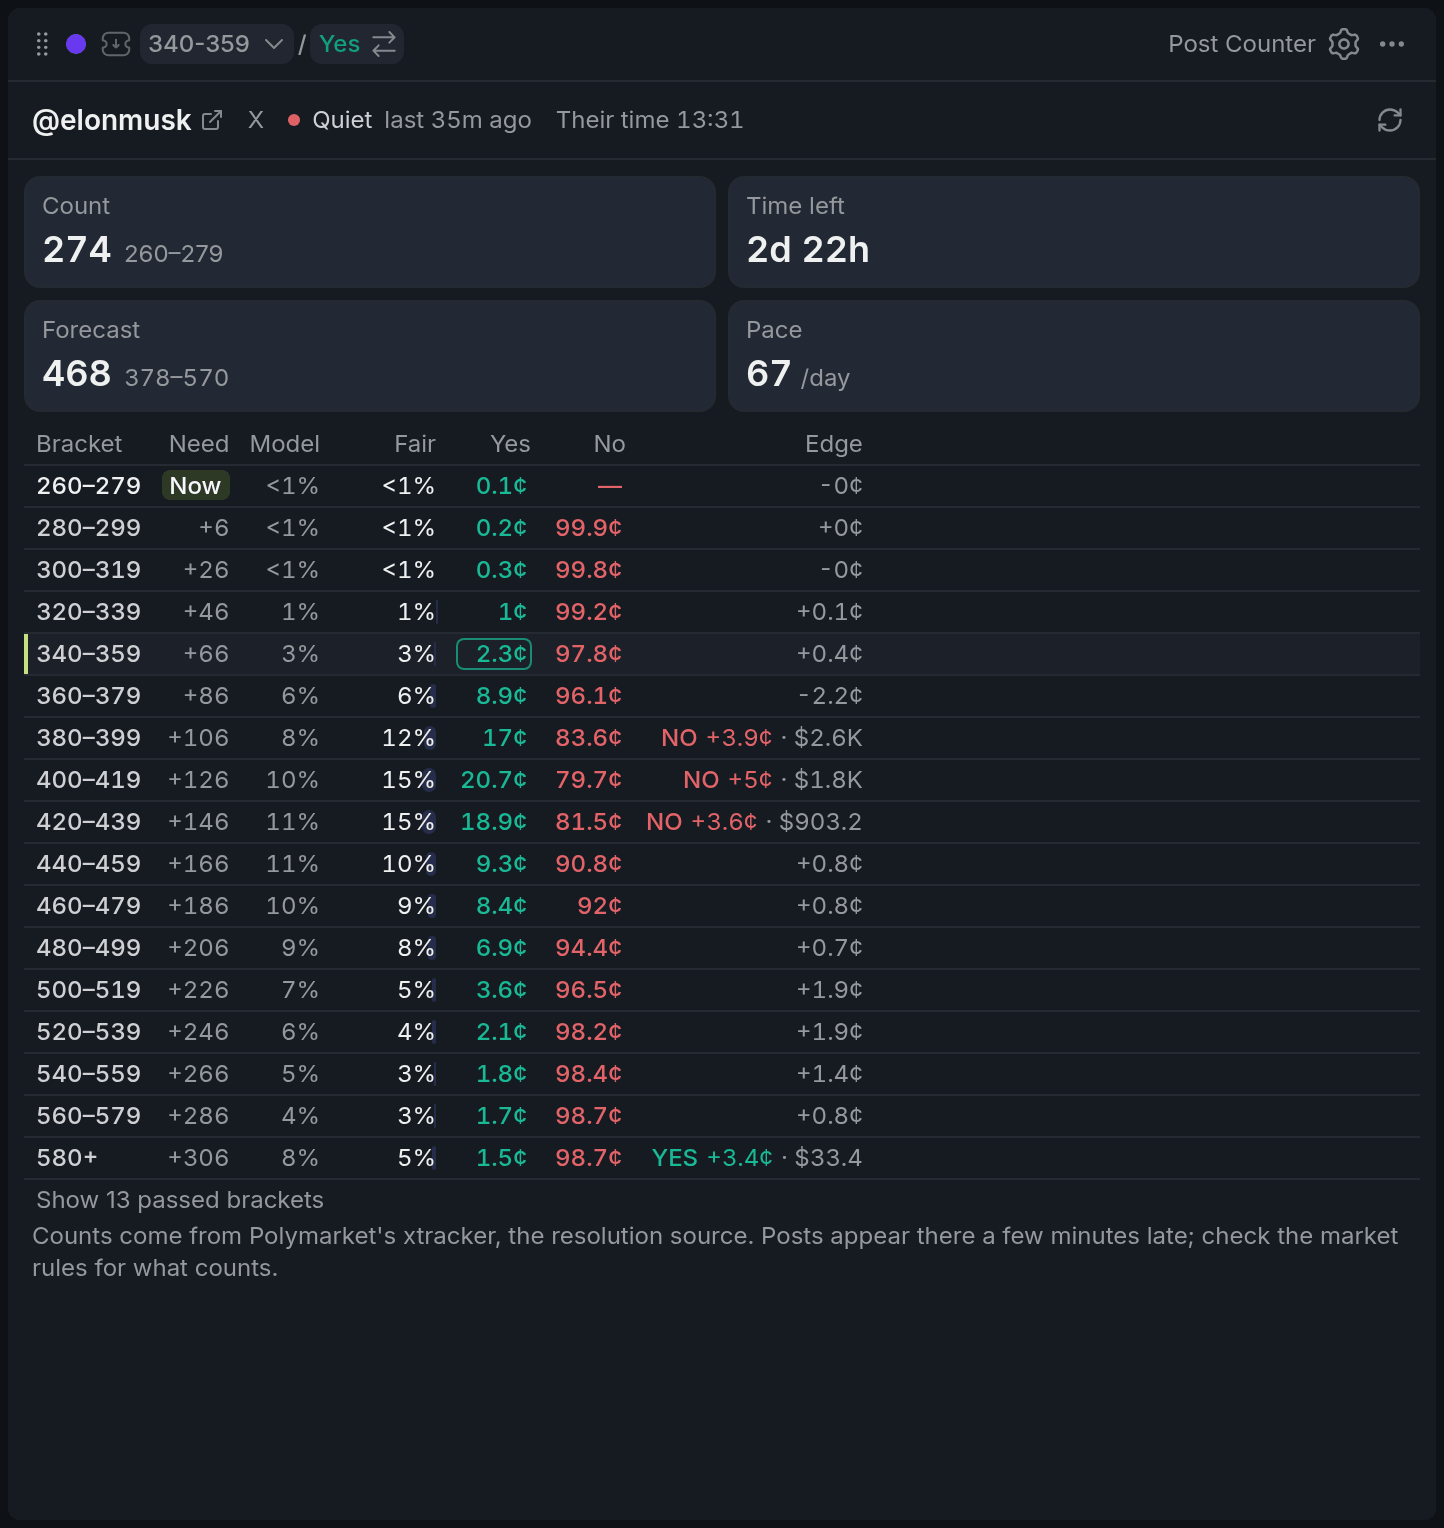
- 1Count card and its bracket
- 2Forecast card
- 3Posts still needed; Now is the current bracket
- 4Fair column
- 5Highlighted edge
The cards show the count and its bracket, the time left, the forecast and the pace, read the same as in Post Scanner.
Each bracket row shows the posts it still needs (Now marks the current one), the model's chance, the Fair price blended with the book, the Yes and No asks in cents, and the edgeEdgeHow much cheaper a side trades than its fair price, in cents. A positive edge means the price looks too low for what the outcome is worth.. Brackets the count has passed are hidden until you show them under the table.
Using it
Trade a bracket
Click a row and the colour switches to that bracket on the side with the edge (Yes if there's none), and its ask goes to the Betslip as a limit priceLimit orderAn order to buy or sell at your price or better. Whatever doesn't fill right away waits in the book.. Click Yes or No to pick the side yourself. Nothing is placed until you submit.
Final stretch
In the last 24 hours (you can change that in settings), a line above the table shows how many posts the next bracket needs, its chance and the hourly rate that takes.
When the window closes, the count can still move for about 10 minutes while the tracker catches up. Don't treat the first final number as settled.
Charts
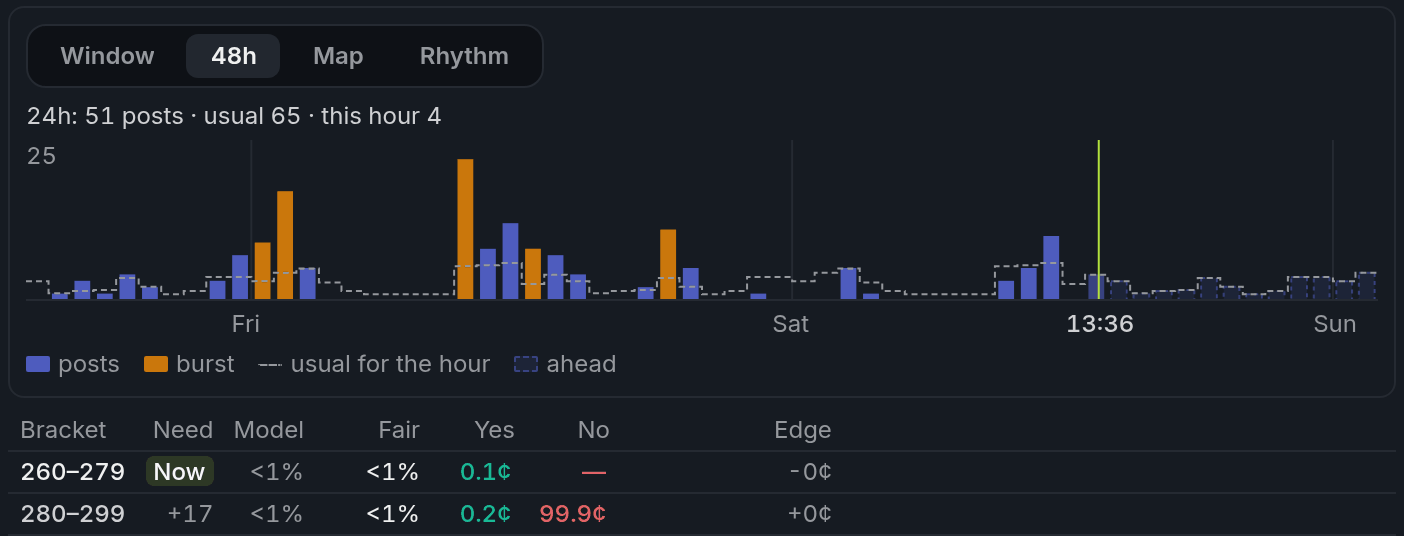
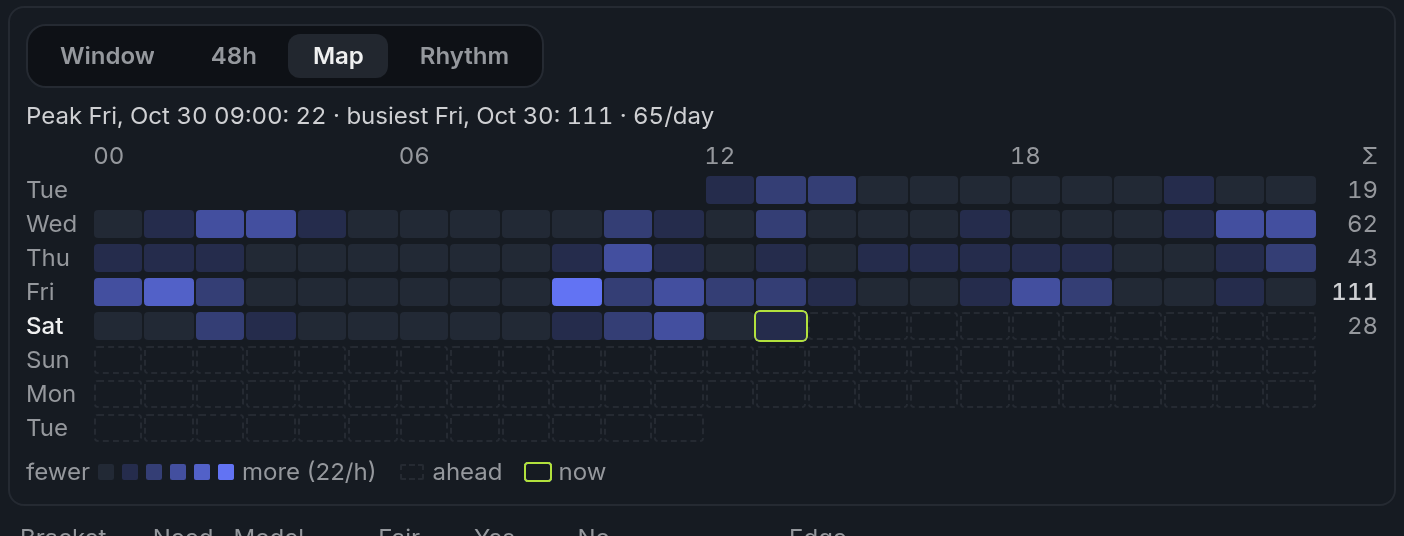
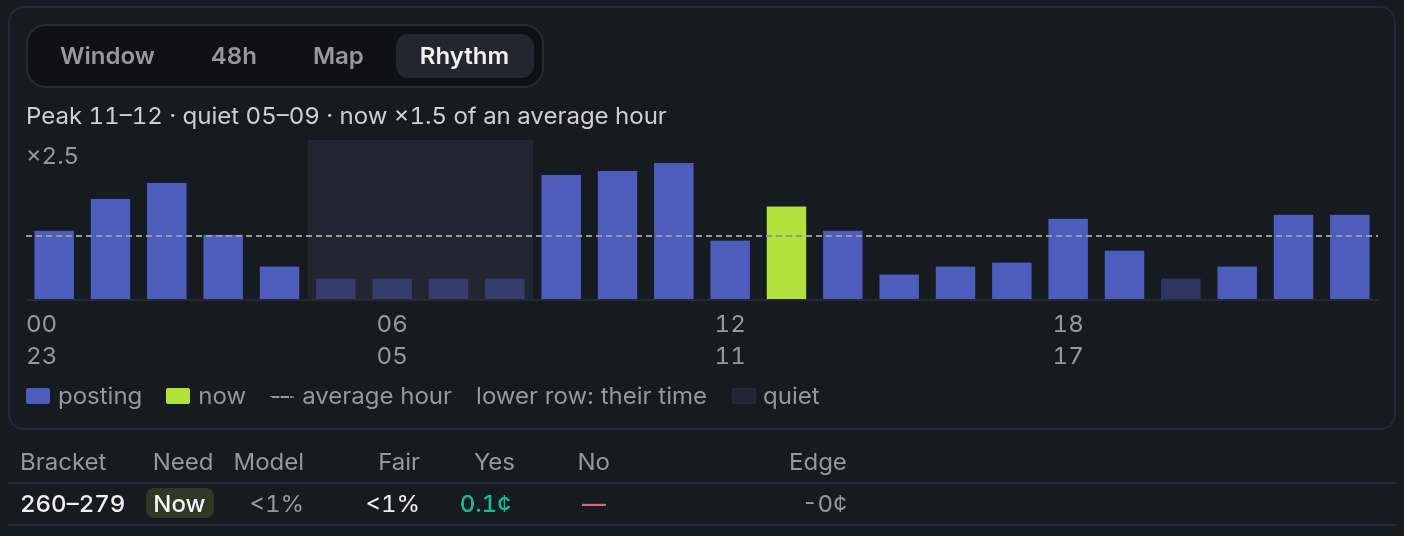
The chart has four views: the whole window with its forecast range, the last 48 hours against the usual, a map of every hour, and the account's daily rhythm.
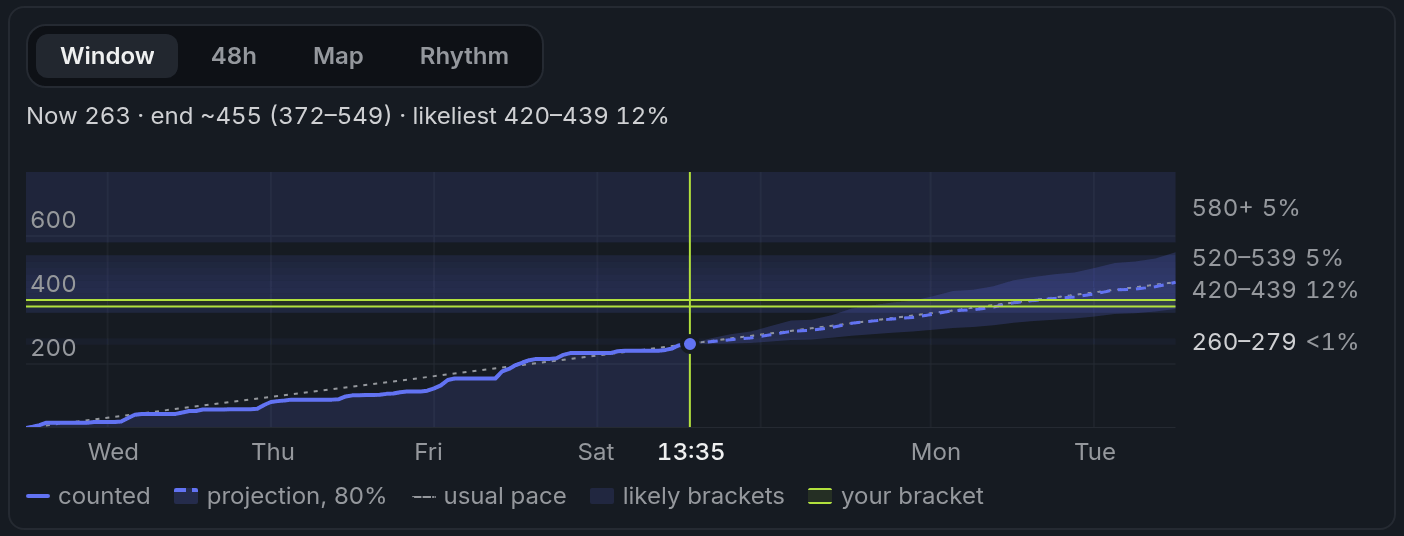
- 1Count line
- 2Forecast range
- 3Likely-bracket bands
With other widgets
- Click a window in Post Scanner and Post Counter switches to it.
- Post Feed in the same colour shows the posts as they land.
Tips
- In the final stretch, compare the rate the next bracket needs with the last few hours on the 48h view. If the account has been posting well below it, that bracket is a long shot.
- Check Rhythm before you trust the forecast overnight. If the account's busy hours are still ahead in its time zone, the count has room to move.
- Holding the window? Scan the If final column before adding: it shows which brackets would hurt you.
Finish reading to complete this lesson
Extras
Your position
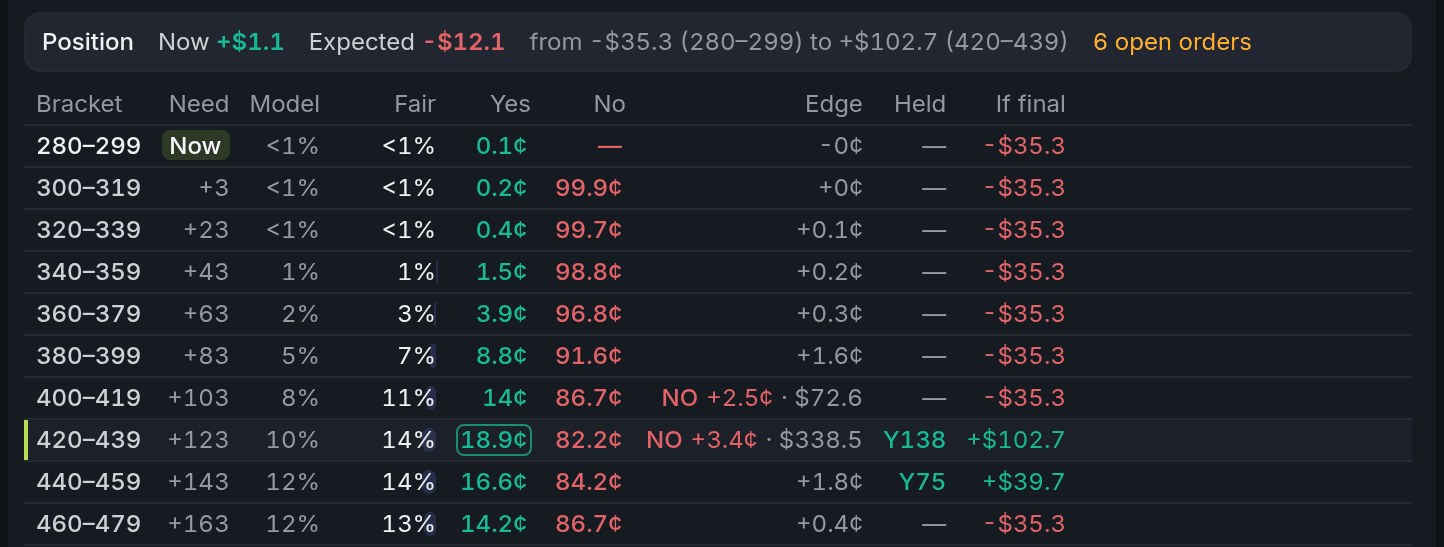
- 1Now: P&L at the bid
- 2Expected at resolution
- 3Worst to best case
- 4If final: your P&L per bracket
If you hold the window, a summary shows your P&L if you sold at the bid now, the expected P&L at resolution, and the worst and best case. Held shows your shares per bracket, and If final your P&L if the count lands there.
More on the numbers
- A Fair price with
*has no book behind it yet, so it's the model alone. - With less than a day of history, the forecast is flagged as a rough guess.
- Counts come from Polymarket's xtracker, the market's resolution source. Posts land there a few minutes late.
- After the window closes, the widget shows the final count and its bracket, then waits for the market to resolve, usually about 2 hours after the end.
Settings
| Setting | What it does |
|---|---|
| Hide passed brackets | Hides brackets below the current count, which can no longer win. |
| Positions | The Held and If final columns and the position summary. |
| Columns | Which columns the table shows. |
| Fair price | Blend (half model, half book) or Model (the raw forecast). |
| Highlight edge from | The edge in cents below which it stays grey and a row click opens Yes. 2¢ by default. |
| Final stretch | How long before the end the line to the next bracket appears: 6h, 12h, 24h or 48h. |
| Burst badge | Shows the Burst badge in the header. |
| Activity chart | Shows or hides the charts. |