Chapter 4 · Analysis · Lesson 5 · 3 min
Compare Chart
Up to four markets of one event on a single chart. See who's gaining, who's fading and by how much.
Compare Chart puts the chances of several markets from the same event on one chart, like the candidates in an election or the teams in a league. It shows who's gaining on whom. It follows the event of its colour's market, so link it to a colour group.
What you see
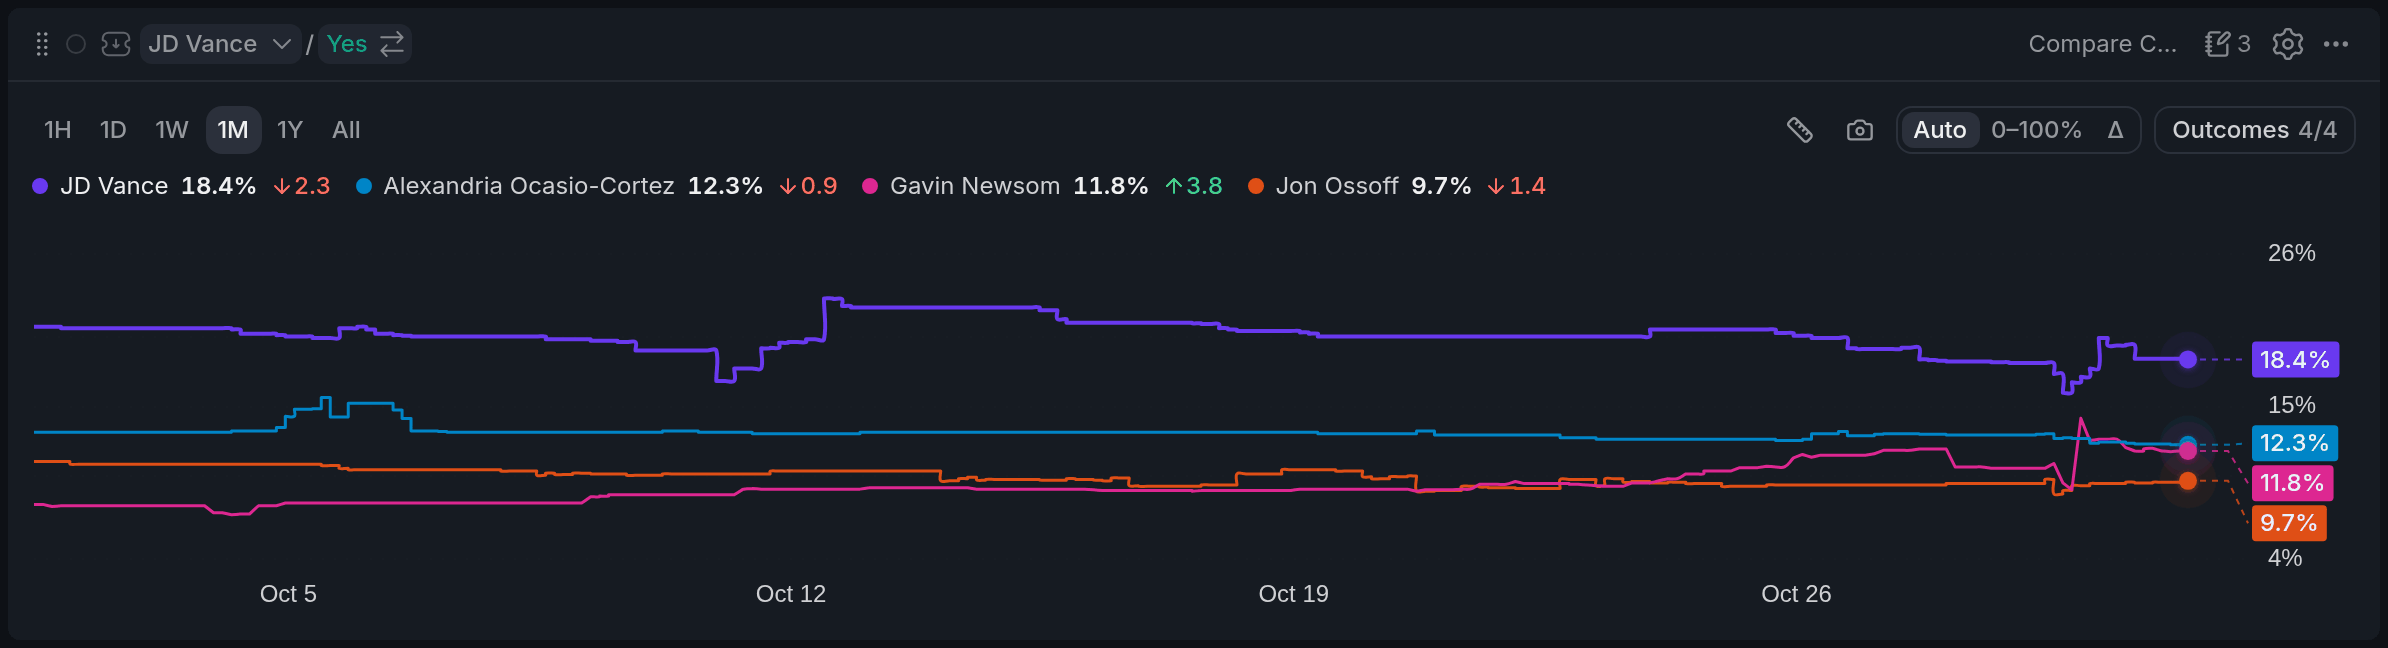
- 1Range buttons
- 2Chance and change over the range
- 3Value pill on the axis
- 4Outcomes 4/4
- 5View switch
Each line is one market's Yes chance over time. The legend above the chart shows each market's current chance and how many percentage points it moved over the range you picked. The coloured pills on the right axis carry each line's latest value.
Out of the box you get the four likeliest open markets. The market picked in your colour also gets its own line, in a neutral colour, if it isn't one of the four.
Using it
Choosing the lines
Outcomes opens the list of the event's markets: tick up to four to compare. Click a name in the legend to hide or show its line, and double-click it to show only that one. Hover a name to bring its line forward.
Your picks stay with this event. When the colour moves to another event, the chart starts again from that event's four likeliest markets.
Views
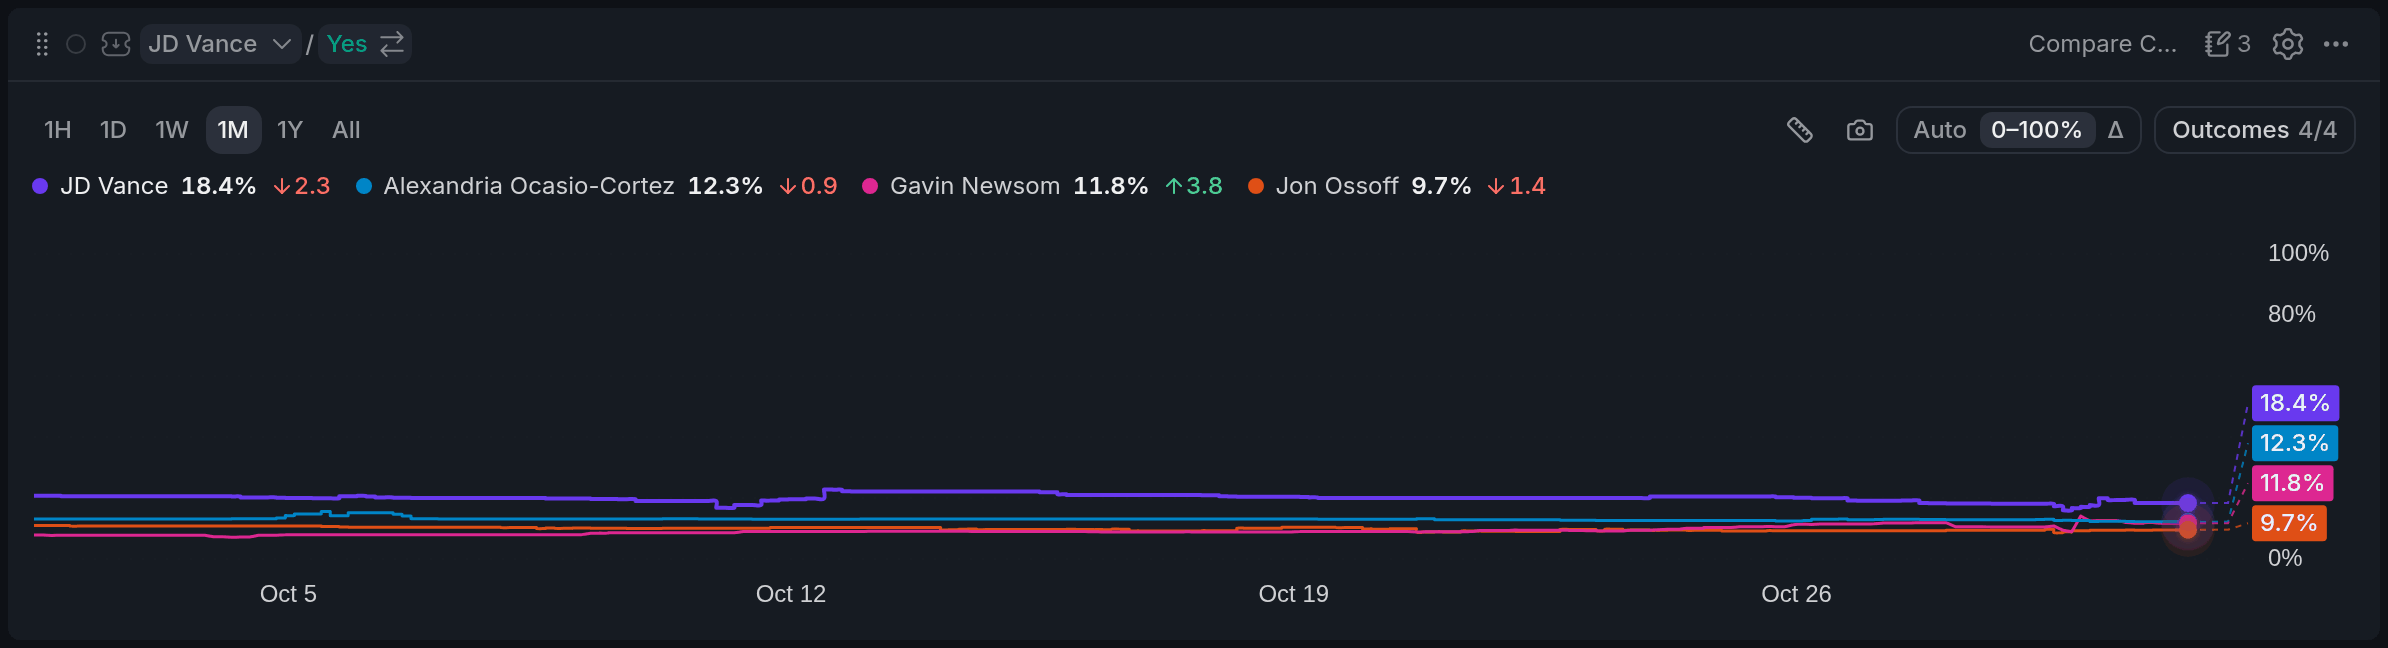
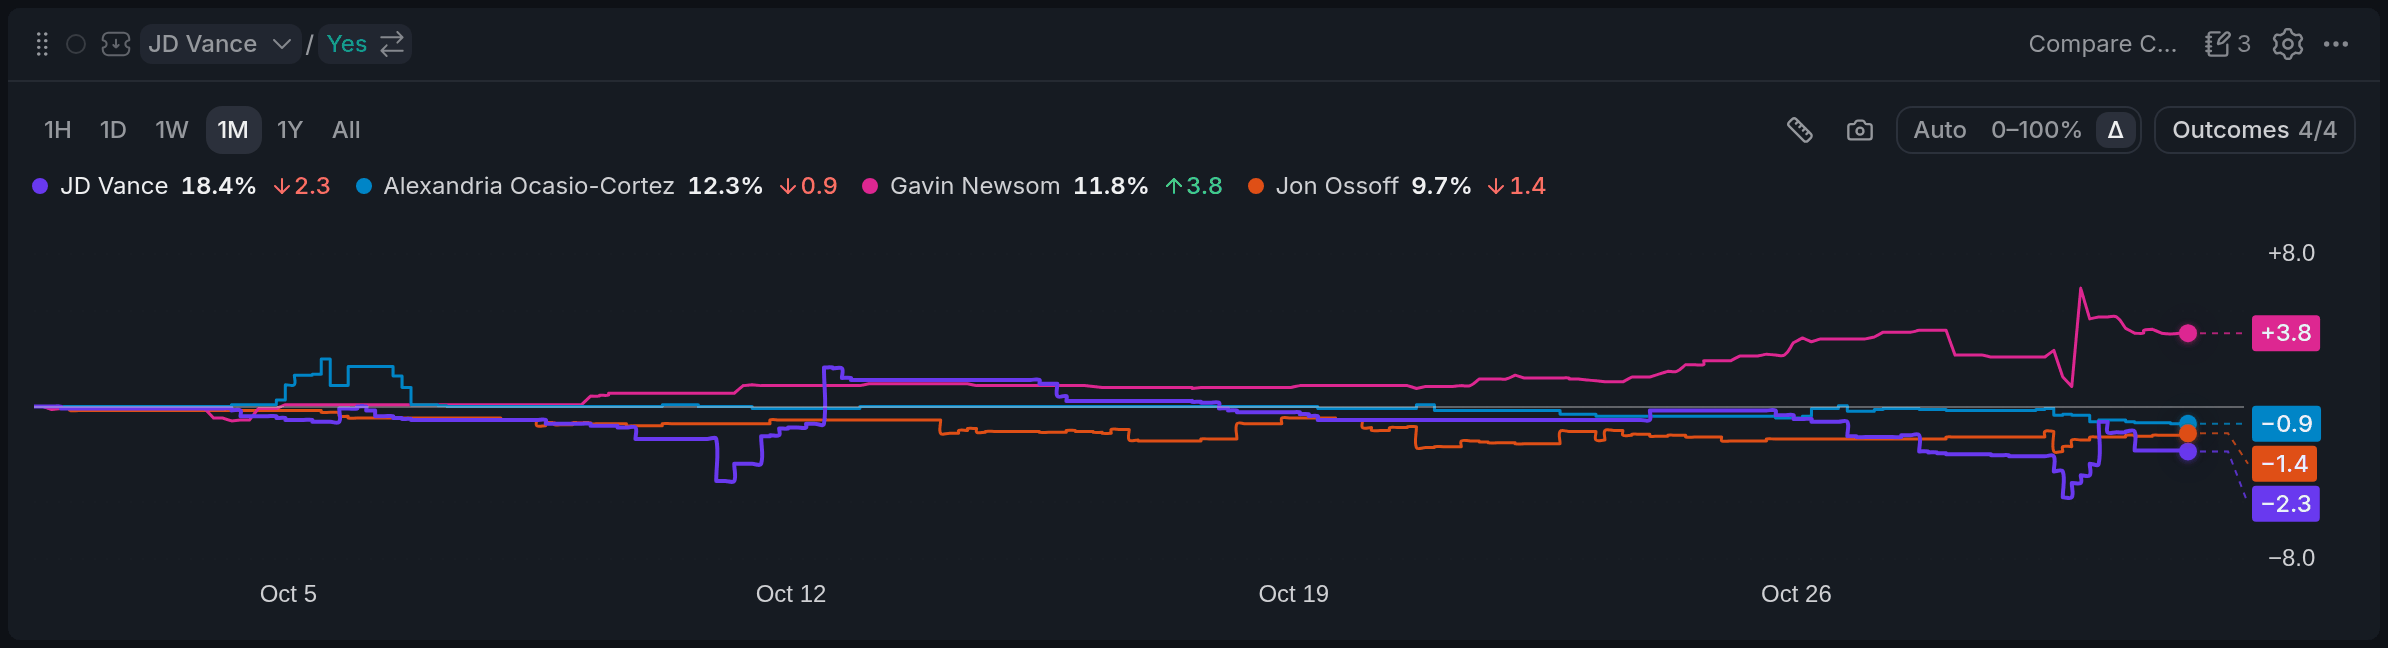
The view switch above the chart changes the scale. Auto zooms in on the lines, 0–100% keeps the full probability range, and Δ starts every line at zero, so you see who's moving faster rather than who's ahead. Pick the time range on the left, from 1H to All.
Measuring a move
Click any point on the chart to pin it. Hover elsewhere and each line shows how far it moved between the two moments. Want a fixed window instead? Press the ruler, then click a start and an end. Esc clears it.
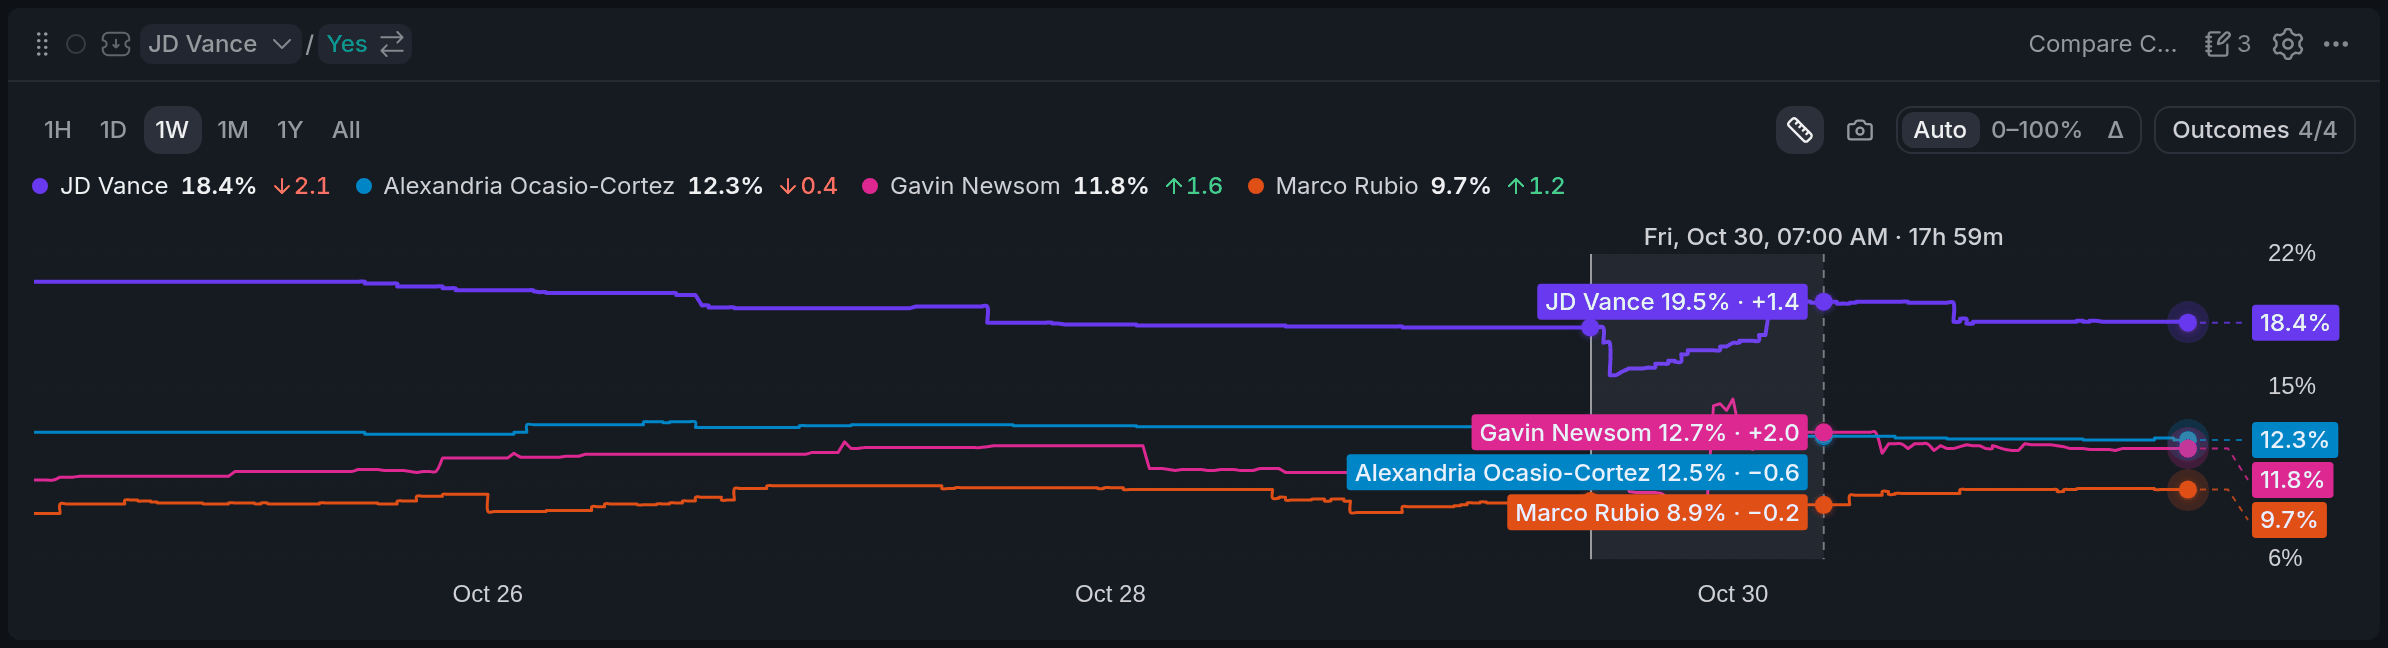
- 1Ruler: measure a window
- 2Measured window: 17h 59m
- 3Change in the window: +1.4
With other widgets
- The chart follows its colour's event. Pick a market from another event anywhere in that colour and the chart switches.
- Click a line's value pill on the right axis, and that market becomes the colour's market: your Orderbook and Betslip switch to it.
Tips
- After big news, switch to Δ over 1D. The line that jumps most is the one the market rethought.
- Put it next to an Orderbook in the same colour and use the axis pills to flip the book between the markets you're watching.
- Hide the favourite to see the race for second place on a readable scale.
Finish reading to complete this lesson
Extras
Sharing it
The camera button copies the chart as an image, with the event title, the current values and the time, ready to paste into a chat.
Settings
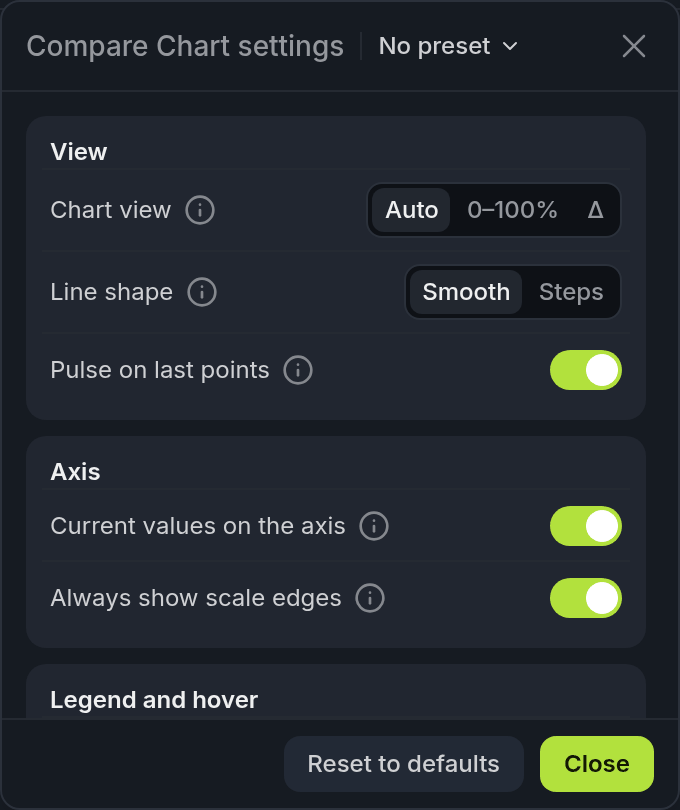
- 1Chart view: Auto / 0–100% / Δ
- 2Line shape: Smooth / Steps
- 3Current values on the axis
| Setting | What it does |
|---|---|
| Chart view | Auto, 0–100% or Δ, the same as the switch above the chart. |
| Line shape | Smooth rounds the 1¢ steps, Steps shows every move exactly. |
| Pulse on last points | A soft ring on each line's latest value. |
| Current values on the axis | The value pills on the right axis. |
| Always show scale edges | Keeps the top and bottom labels, like 0%, next to the pills. |
| Change over the range | The arrow with the change next to each name in the legend. |
| Change since the hovered moment | In the hover pills, how far each line has moved from that moment to now. |
| Short names when narrow | Surnames only, when the markets are people and the widget is narrow. |