Chapter 4 · Analysis · Lesson 3 · 4 min
Holders Map
A market's top holders as bubbles. See who owns each side, how good they are and who could move the price.
Holders Map draws a market's biggest holders as bubbles: the bigger the bubble, the bigger the position. You see at a glance who owns each side and whether they know what they're doing. It shows one market, so link it to a colour group. For the same wallets as a plain list, use Holders.
What you see
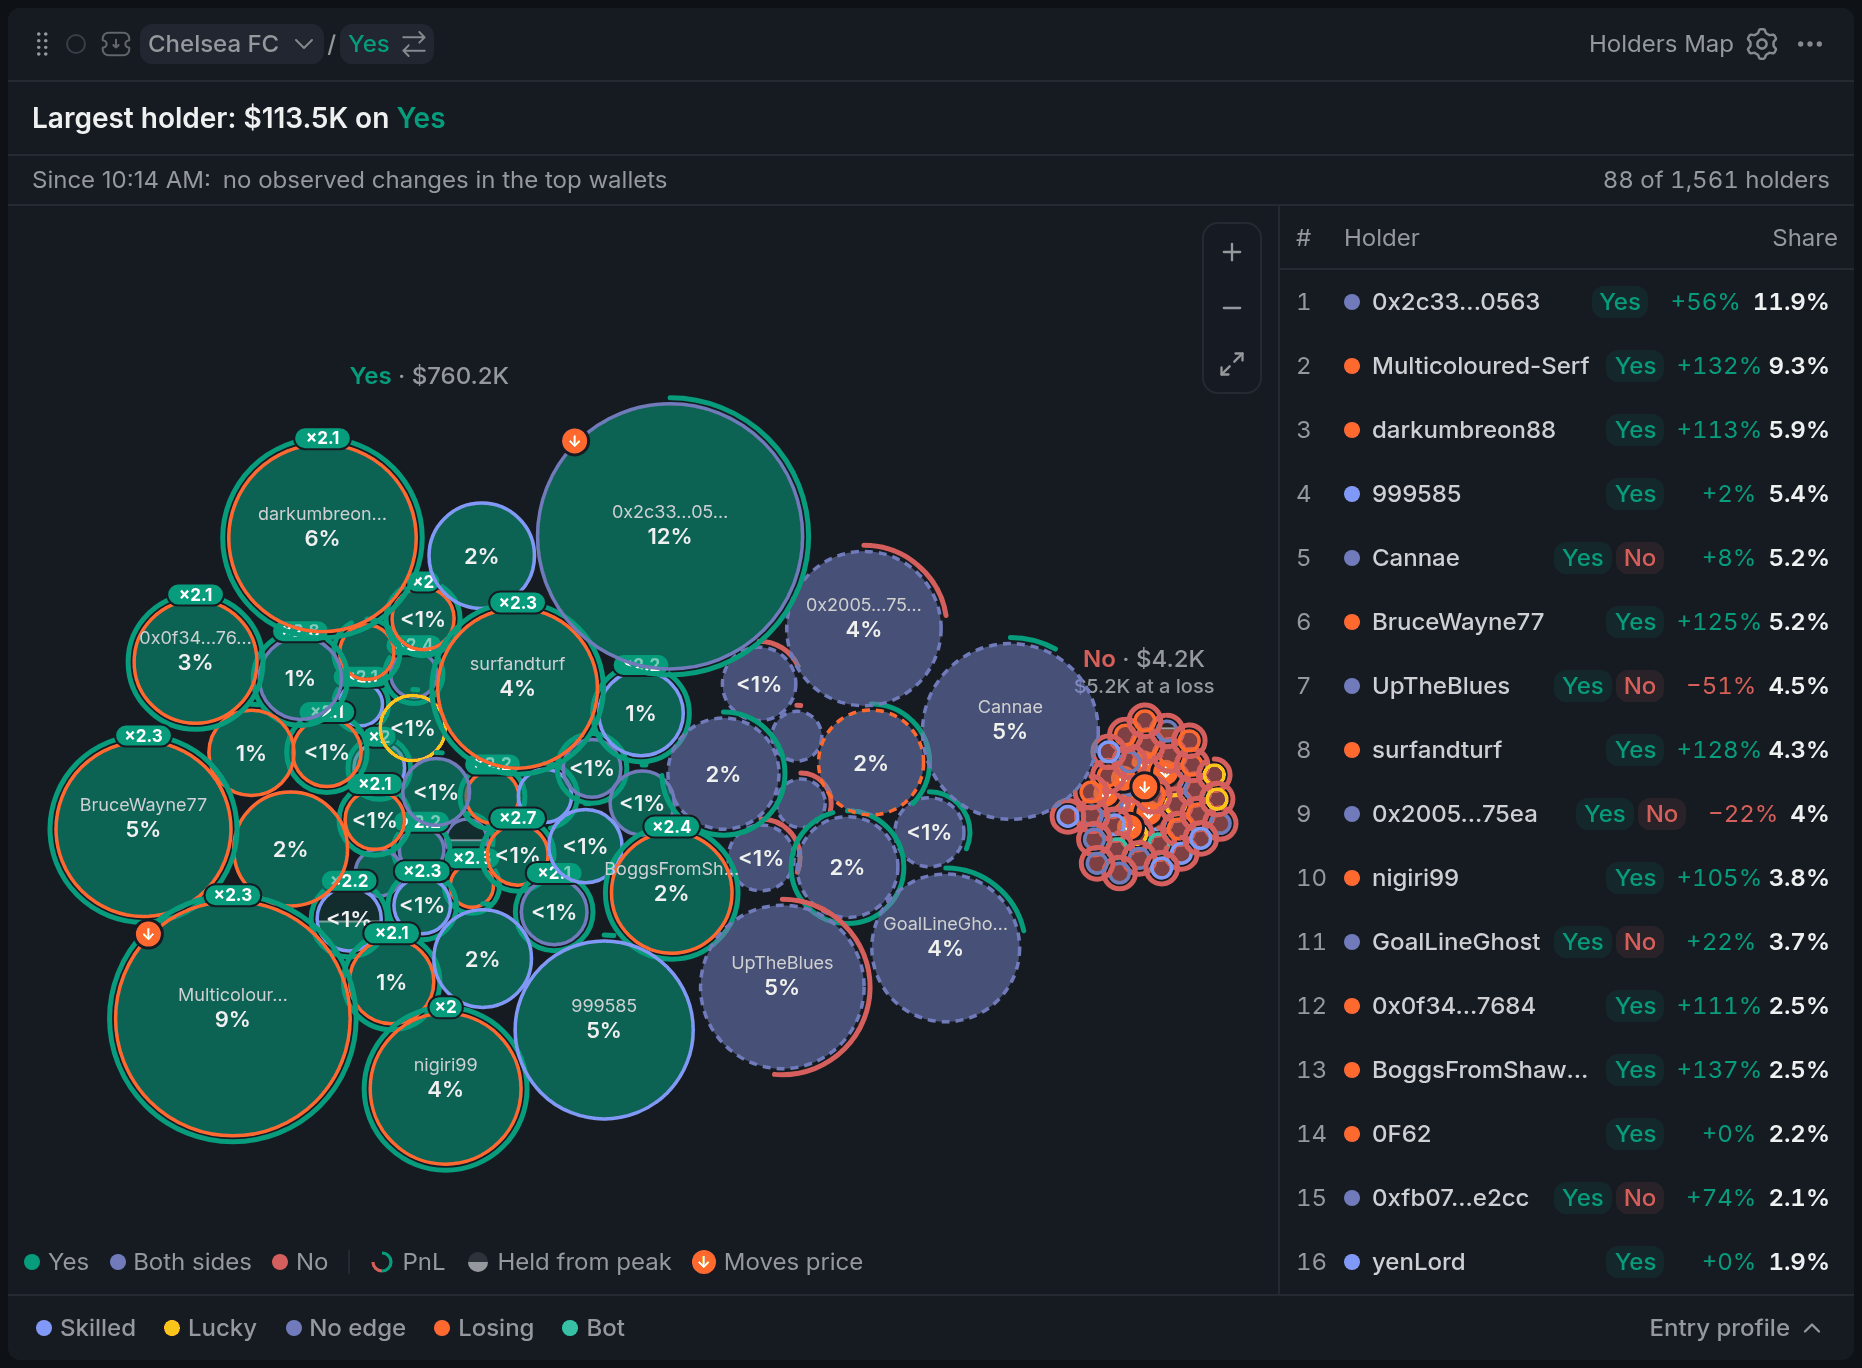
- 1Headline: the market in one line
- 2Cluster: side, total, at a loss
- 3Arc is open PnL, number is share
- 4Dashed outline: holds both sides
- 5Type chips light up one wallet type
Bubbles cluster by side, and each cluster is captioned with its total in dollars and how much of it is at a loss. Green bubbles hold Yes, red ones hold No, and grey ones with a dashed outline hold both. The number inside is the wallet's share of all the money on the map.
The outline colour is the wallet type, judged on its track record: Skilled, Lucky, No edge, New, Losing, Bot or No data. Skilled means a long record of real, repeatable profits.
The arc around a bubble is the position's open PnL: green for profit, red for loss, a full ring at ±100%. Above +100% you'll see the multiple, like ×3.
The line above the map sums the market up in one sentence, such as "One wallet holds 45% of all Yes money" or "Skilled money bets No against the crowd". The legend along the bottom explains every marker.
Using it
Checking a wallet
Hover a bubble for the wallet's positions, entry price, PnL and track record. Click it for the full read under the map: how much of its peak position it still holds, what selling everything now would do to the price, and its stats. Open profile opens the trader window from Live Trades.
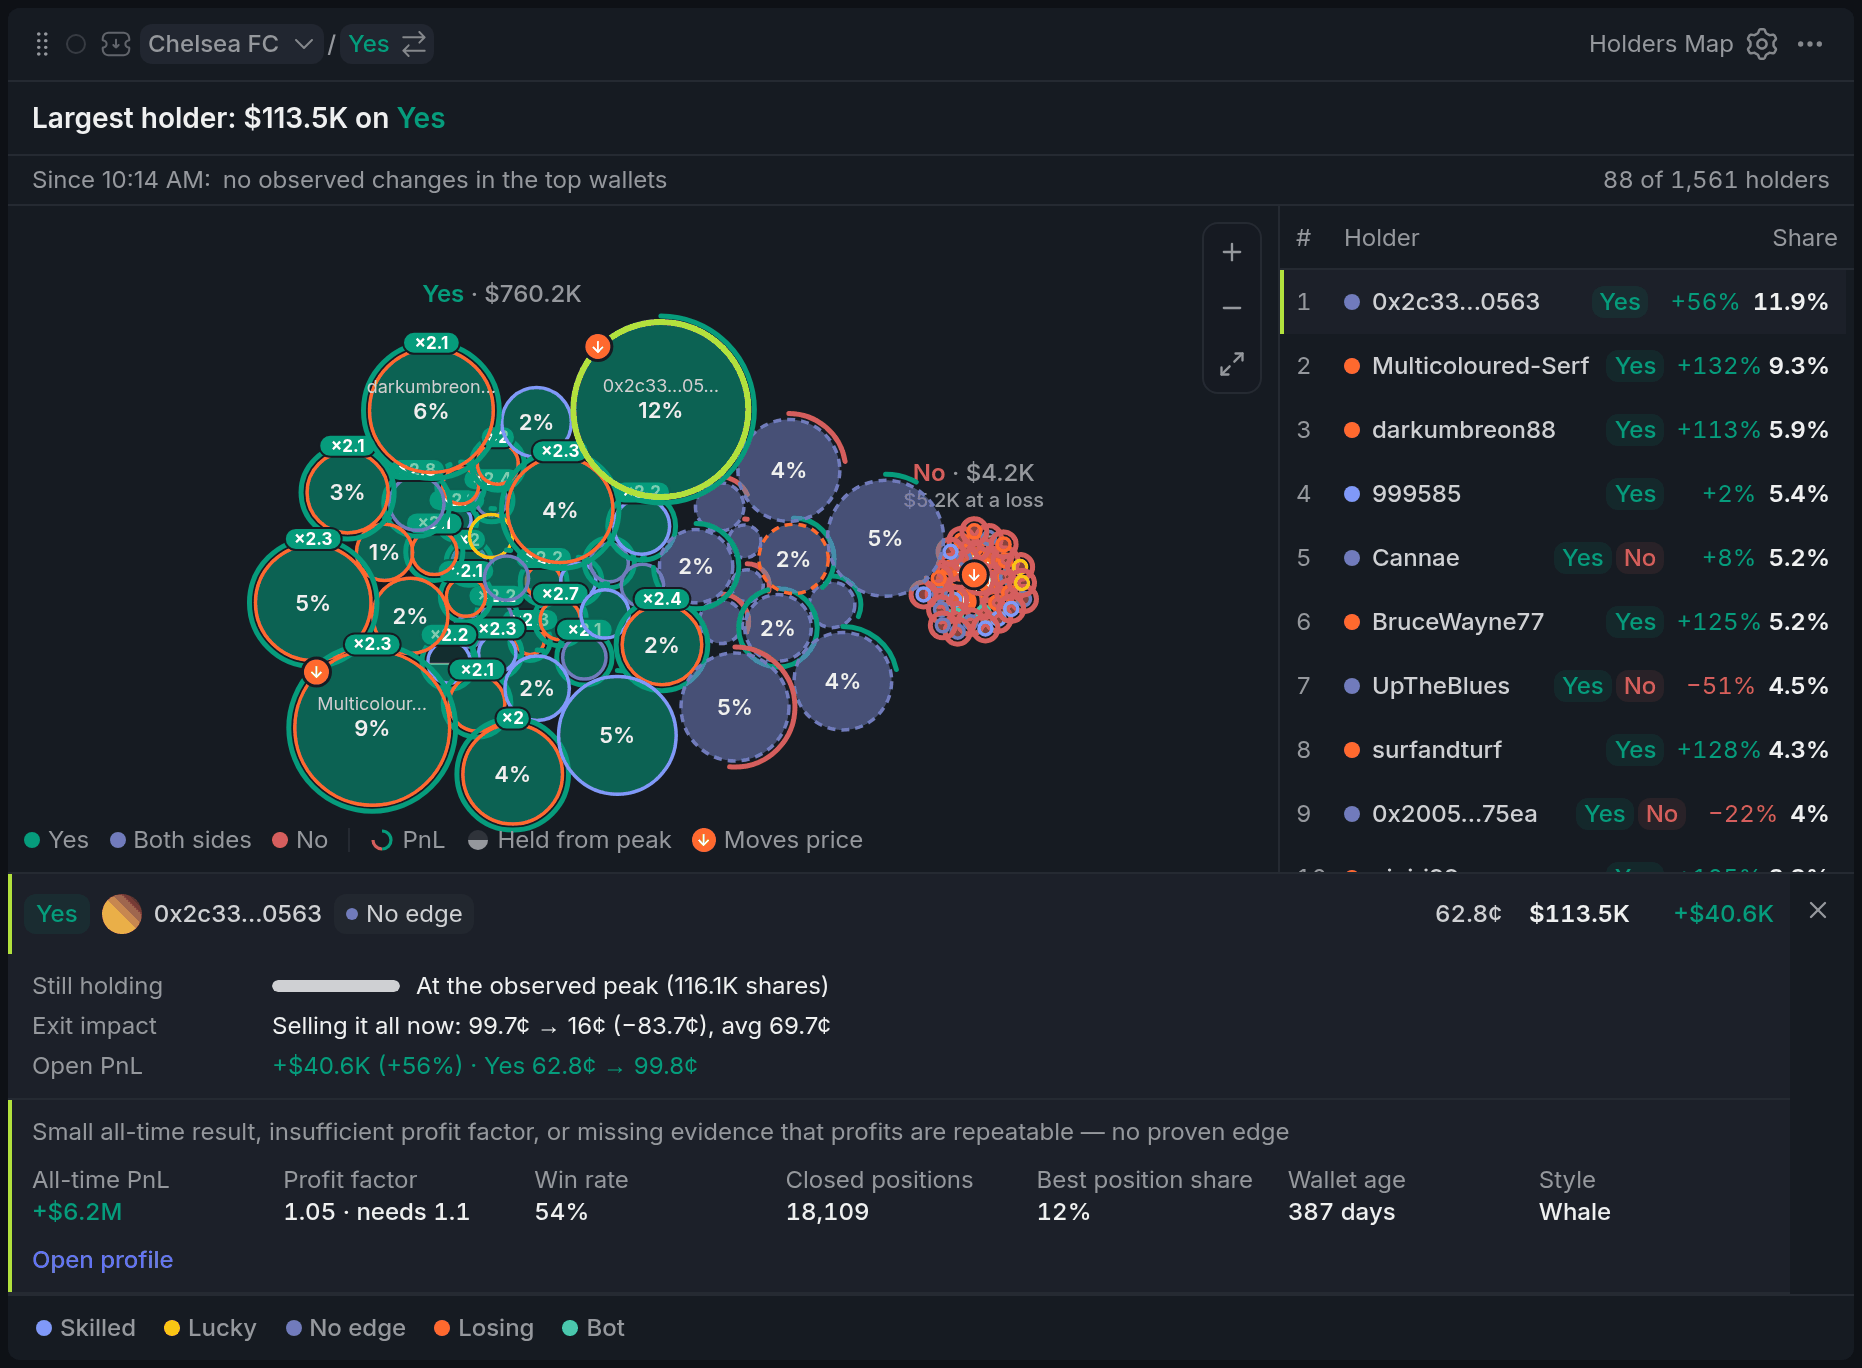
- 1Clicked bubble: its details open below
- 2How much of its peak it still holds
- 3Exit impact: price if it sells all
- 4Open profile: the trader window
Drag bubbles to untangle them, scroll to zoom and drag empty space to pan.
Finding a type of wallet
The chips under the map light up one wallet type, such as Skilled or Bot, and fade the rest. On a wide widget, a ranked wallet list sits beside the map: hover a row to find its bubble.
Entry profile
The Entry profile under the map shows at what prices holders' money came in, with today's price marked. It tells you whether most holders bought cheap or chased the price.
With other widgets
- The map always follows its colour's market.
- A wallet you've marked shows its dot on its bubble, as in Live Trades, Holders and Smart Money.
Tips
- Read the headline first. One wallet holding nearly half a side can swing the price whenever it moves.
- About to join a side? Look for ↓ arrows there. Those wallets would push the price down if they sold out.
- Markets with active market makers look noisy. Turn on Hide bots in settings to see only the money that's actually betting.
Finish reading to complete this lesson
Extras
Reading the markers
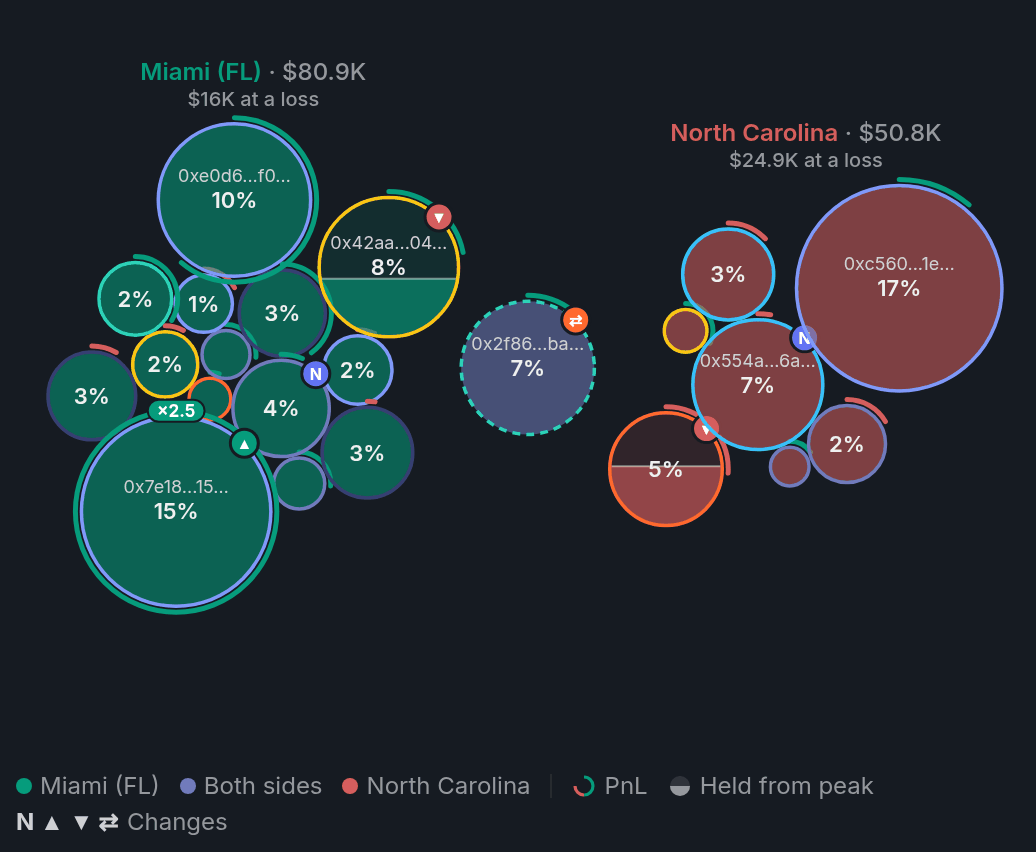
- 1×N: the position more than doubled
- 2Held from peak: part of the peak sold
- 3⇄: switched sides since the last update
- 4Legend: what each mark means
| Marker | What it means |
|---|---|
| Dashed outline | The wallet holds both sides. |
| Arc and ×N | Open PnL. A full ring is ±100%; ×N shows a position that has more than doubled. |
| Held from peak | The wallet has sold part of its position. The fill shows how much of its peak it still holds, from the trade history Pro could load. |
| ↓ | Selling the whole position into the current book would drop the price by 5¢ or more, or the book couldn't take it. |
| Changes | N, ▲, ▼ and ⇄ since the last update: new in the top, added, cut, switched sides. |
The changes line
The line under the headline shows the money that came in or left each side since the last update, and how many wallets joined or left the top. Price moves alone don't count. On the right, it says how many of the market's holders the map covers.
Settings
The settings are split into three tabs: Map, Markers and Panels.
| Setting | What it does |
|---|---|
| Colour bubbles by | Side (the default) or Wallet type. With Wallet type, the fill shows the type and the outline shows the side. |
| Labels on bubbles | The share and wallet name inside large bubbles. |
| Smallest position | Hides bubbles under $100, $1,000 or $10,000. The headline still reads the whole market. |
| Hide bots | Hides market-making bots. |
| PnL arc, Multiples above +100% | The PnL arc and its ×N tag. |
| Held from peak | The lower fill for wallets that have sold part of their position. |
| Moves-price arrow, Arrow from | The ↓ arrow, and how big a drop earns it: 3¢, 5¢ or 10¢. |
| Change badges | The N, ▲, ▼ and ⇄ badges. |
| Headline, Changes and coverage line, Wallet list, Entry profile, Legend | Turn parts of the widget off to give the map more room. |
| Refresh analysis | Reloads the holders right away. |